
Meet Zoom AI Companion, your new AI assistant!
Boost productivity and team collaboration with Zoom AI Companion, available at no additional cost with eligible paid Zoom plans.
Updated on March 04, 2026
Published on March 04, 2026


Measuring performance in a contact center is important because every customer service interaction, response time, and resolution impacts the quality of your service. To truly understand where your team stands and how to improve, you need to monitor the right metrics.
These key performance indicators (KPIs) are designed to help you improve response times, increase customer satisfaction, and benchmark your customer service. We’ll explore what call center metrics are, how they work, and how you can use them to improve your call center operations.
Call center metrics provide valuable insights into your contact center’s efficiency, quality, and overall effectiveness. These metrics cover everything from how long customers wait on hold to the number of calls an agent can handle during a shift for a comprehensive view of your team’s performance.
Tracking these metrics helps you understand your call center’s strengths and weaknesses, pinpoint areas for improvement, and make data-driven decisions to enhance your customers’ experience.
Customer experience metrics refer to indicators that measure how your customers feel about your service.
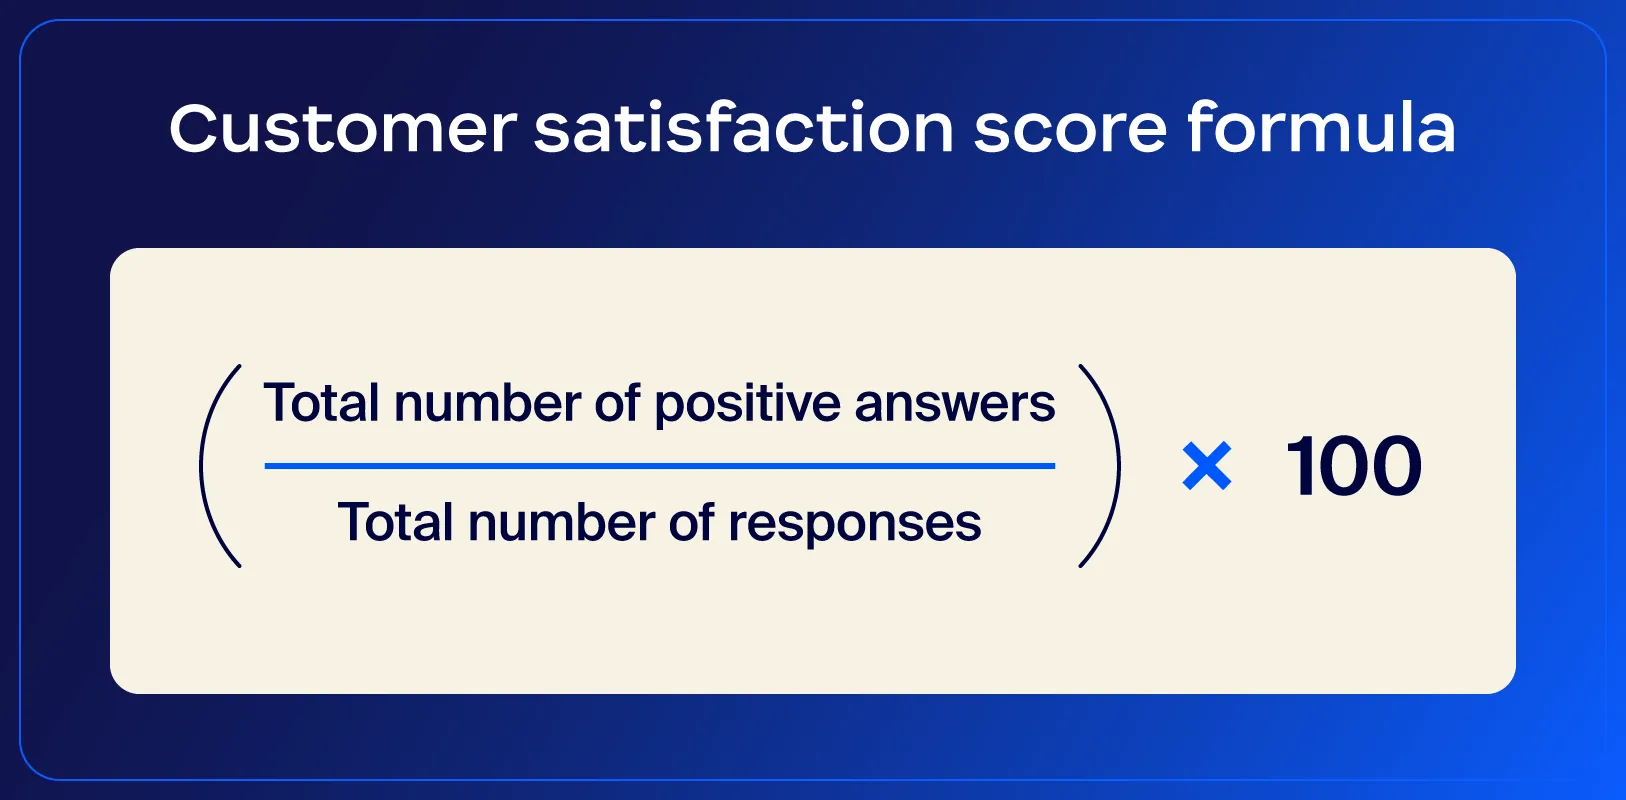
Customer satisfaction score (CSAT) measures how satisfied customers are with a specific interaction or service by asking them to rate their experience with the contact center, typically on a scale of 1 to 5. This feedback helps you understand how well agents handle customer issues, whether interactions are helpful, and whether customers leave each call feeling positive.
To gather CSAT data, use post-contact surveys or automated follow-up messages asking, “How satisfied were you with your experience today?” Responses are then averaged to produce a CSAT score, allowing you to track satisfaction trends over time.
Tip to improve CSAT scores: Empower agents with tools and resources to resolve issues on the first call, boosting customer confidence in your support.
Net Promoter Score® is a popular metric for assessing customer loyalty and gauging how likely customers are to recommend your service to others. NPS is measured by asking customers a simple question: “On a scale of 0 to 10, how likely are you to recommend us to a friend or colleague?” Based on their responses, customers are categorized as Promoters (9-10), Passives (7-8), or Detractors (0-6).
Calculate your NPS by subtracting the percentage of Detractors from the percentage of Promoters. A higher NPS indicates a loyal customer base, while a lower NPS highlights areas where customers may feel disconnected or dissatisfied with your service.
NPS provides a high-level view of customer sentiment and is a valuable predictor of future growth. This is because loyal customers are more likely to promote your brand, driving positive word of mouth and customer retention.
Tip to improve NPS: Use feedback from Detractors to identify pain points and make targeted improvements.
Quality assurance (QA) scores evaluate how well agents adhere to service standards and call center protocols while interacting with customers. QA scores are usually based on specific criteria, such as communication skills, accuracy, empathy, and adherence to company policies.
Assess these scores regularly to maintain service consistency across the team, identify top-performing agents, and pinpoint areas that could benefit from additional training.
Tips to improve QA scores:
First contact resolution (FCR) measures a call center’s ability to resolve customer issues during the first interaction without the need for follow-up calls or escalations. FCR is a critical metric, as it directly impacts customer satisfaction — customers expect quick solutions, and the fewer contacts they need to make, the better their experience usually is.
A high FCR rate reflects efficient problem-solving and agent expertise, while a low FCR rate may indicate issues with training, processes, or resources.
Calculating FCR involves tracking the percentage of cases resolved within a single interaction. Many contact centers use call-tracking software to monitor this metric over time. FCR can be measured across different channels, such as phone, chat, and email, to provide a comprehensive view of resolution efficiency.
Tip to improve FCR: Provide targeted training on common issues and solutions to help agents handle more complex inquiries on the first call.
Customer effort score measures how easy it is for customers to interact with your contact center and resolve their issues. It’s typically assessed by asking customers to rate, on a scale, how much effort was required to complete their interaction or solve their problem.
A lower CES indicates a smoother, more convenient experience, while a higher CES suggests that customers faced obstacles or frustration during the process.
CES highlights potential friction points in your support process, such as complex navigation, long hold times, or multiple transfers between agents. Reducing customer effort not only improves satisfaction but also increases loyalty, as customers are more likely to return to brands that make their experience hassle-free.
Many call centers use CES alongside CSAT and NPS to gain a fuller understanding of the customer journey, revealing ways to streamline processes and improve overall service quality.
Tip to improve CES: Simplify your IVR (interactive voice response) menus and routing processes to get customers to the right agent quickly.
Service level metrics help you measure the effectiveness of your customer support as a whole. It includes quantitative metrics such as average hold times and resolution times, as well as qualitative metrics such as the agent effort score. These stats are worth benchmarking against industry averages and competitors to identify strengths and opportunities for improvement.
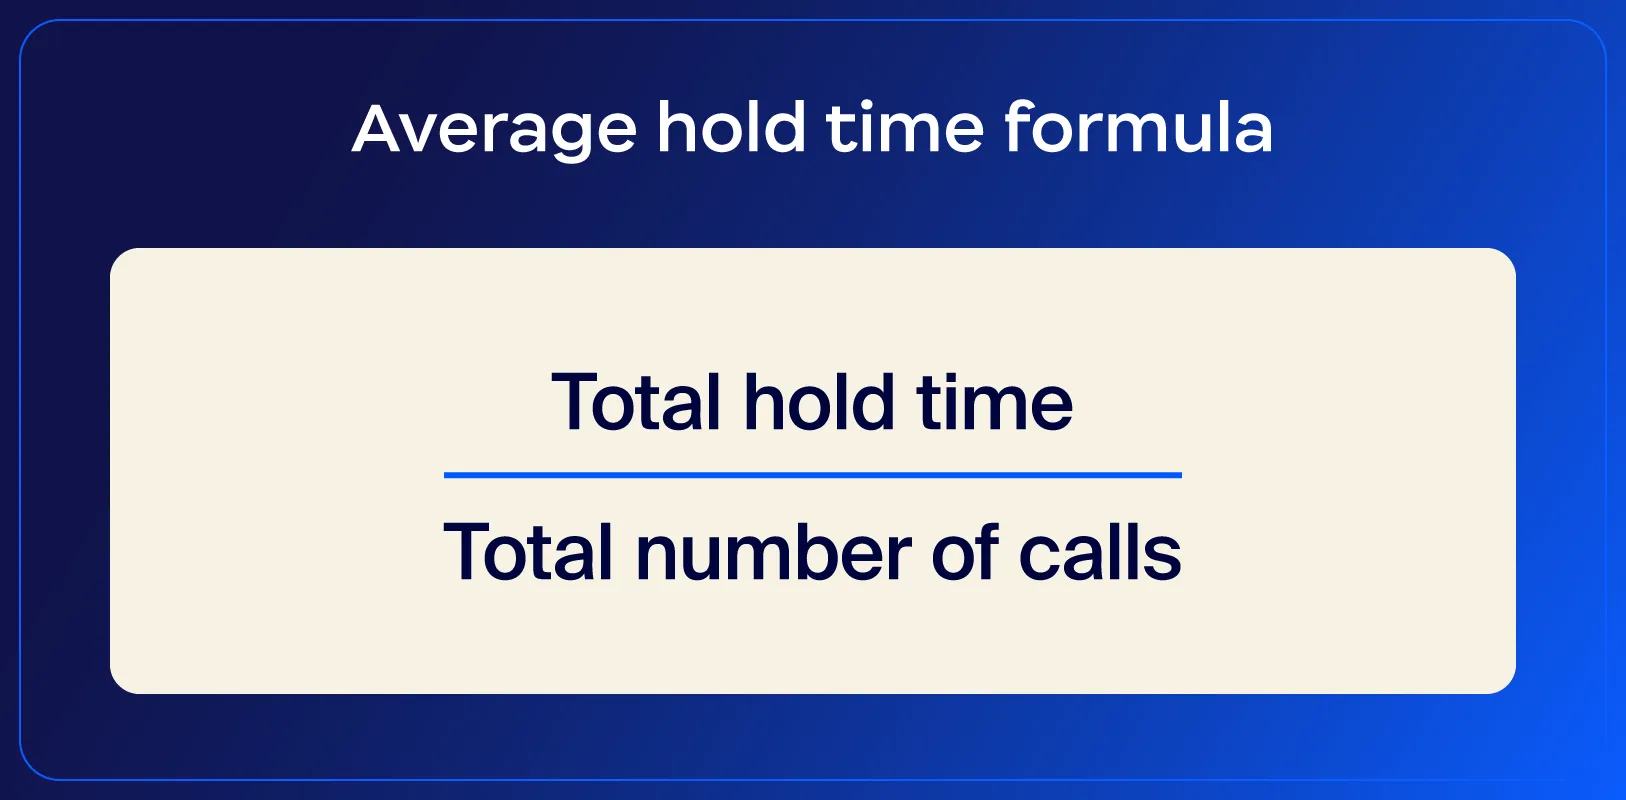
Average hold time measures the average duration a customer spends on hold during an interaction, from the time the customer is placed on hold until they either resume the conversation or the call ends. Average hold time is a key indicator of both customer experience and agent efficiency.
Long hold times often lead to frustration, while short hold times can signify that issues are resolved quickly and effectively.
You can calculate the average hold time by adding the total hold time across all calls and dividing by the number of calls. While reducing average hold time is important, it’s also important to balance it with call quality — rushing to shorten hold time can lead to unresolved issues or subpar service.
Tip to improve average hold time: Invest in an advanced call routing system to connect customers with the right agent quickly and reduce unnecessary transfers.
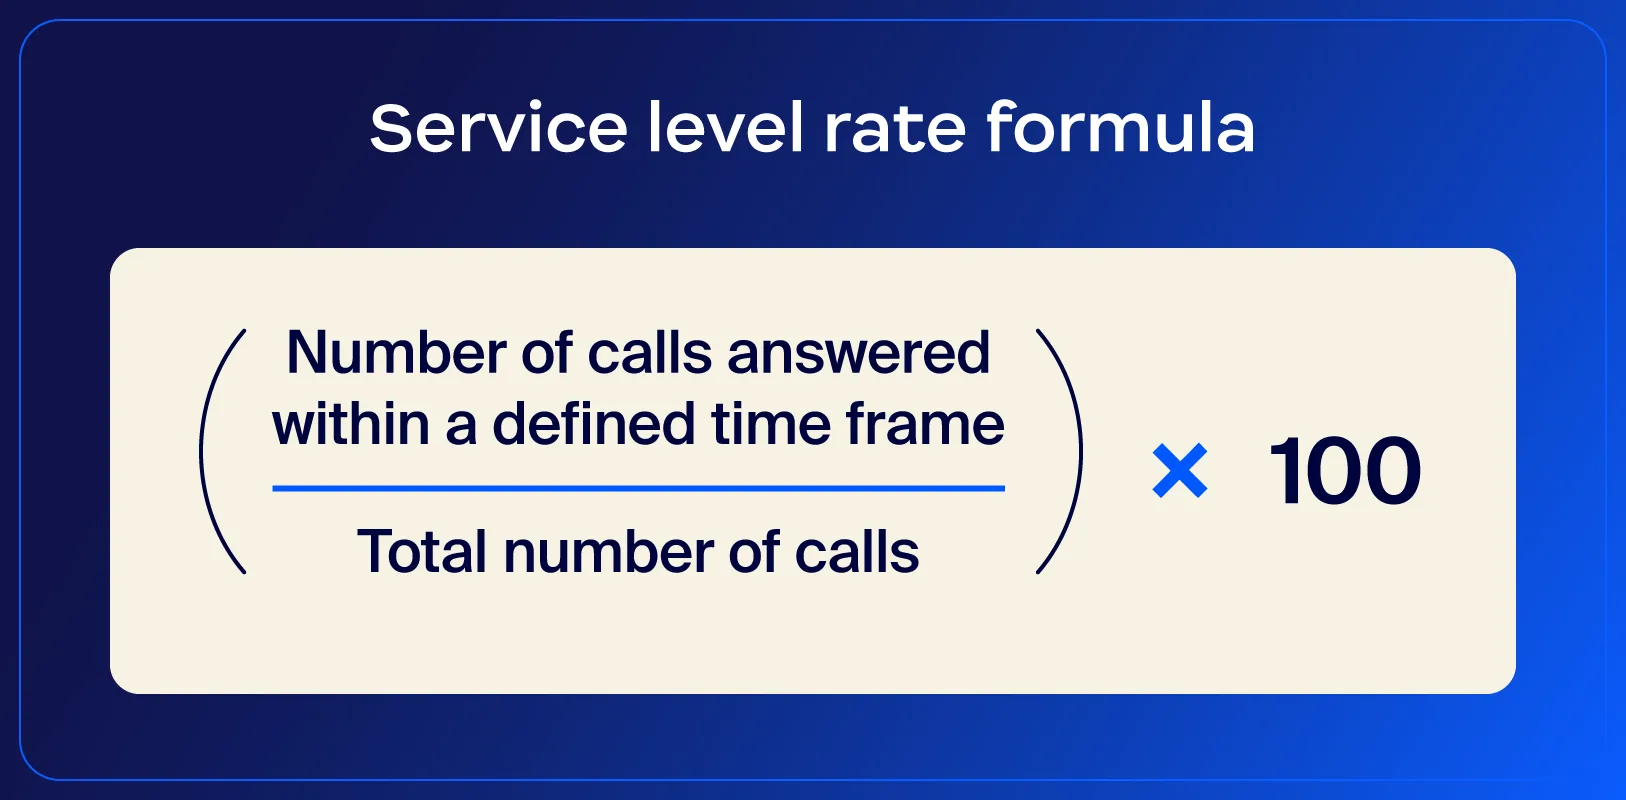
Service level rate measures the percentage of calls answered within a predefined time frame. For example, a common service level goal is to answer 80% of calls within 20 seconds. This metric helps call centers assess their responsiveness and efficiency, directly impacting customer satisfaction.
While meeting service-level targets is an important goal, you also need to be mindful that focusing on speed doesn’t compromise call quality. The service level rate should be balanced with other metrics, such as customer satisfaction and first-contact resolution, to maintain a high standard of service.
Tip to improve service level: Optimize staffing levels based on predicted call volume to support adequate coverage during peak times.
Average first response time (AFRT) measures the time it takes for a contact center to respond to a customer’s initial inquiry, whether through phone, email, chat, or social media. This metric is a key indicator of responsiveness, and it’s calculated by averaging the time between when a customer first contacts the support team and when they receive an initial response.
A lower AFRT indicates your team is efficiently addressing customer inquiries, leading to better experiences and potentially higher first-contact resolution rates. In contrast, high AFRT often results in customer frustration and an increased likelihood of follow-up contacts or escalations.
Tip to improve average first response time: Implement a ticketing or CRM system to streamline and prioritize responses based on urgency.
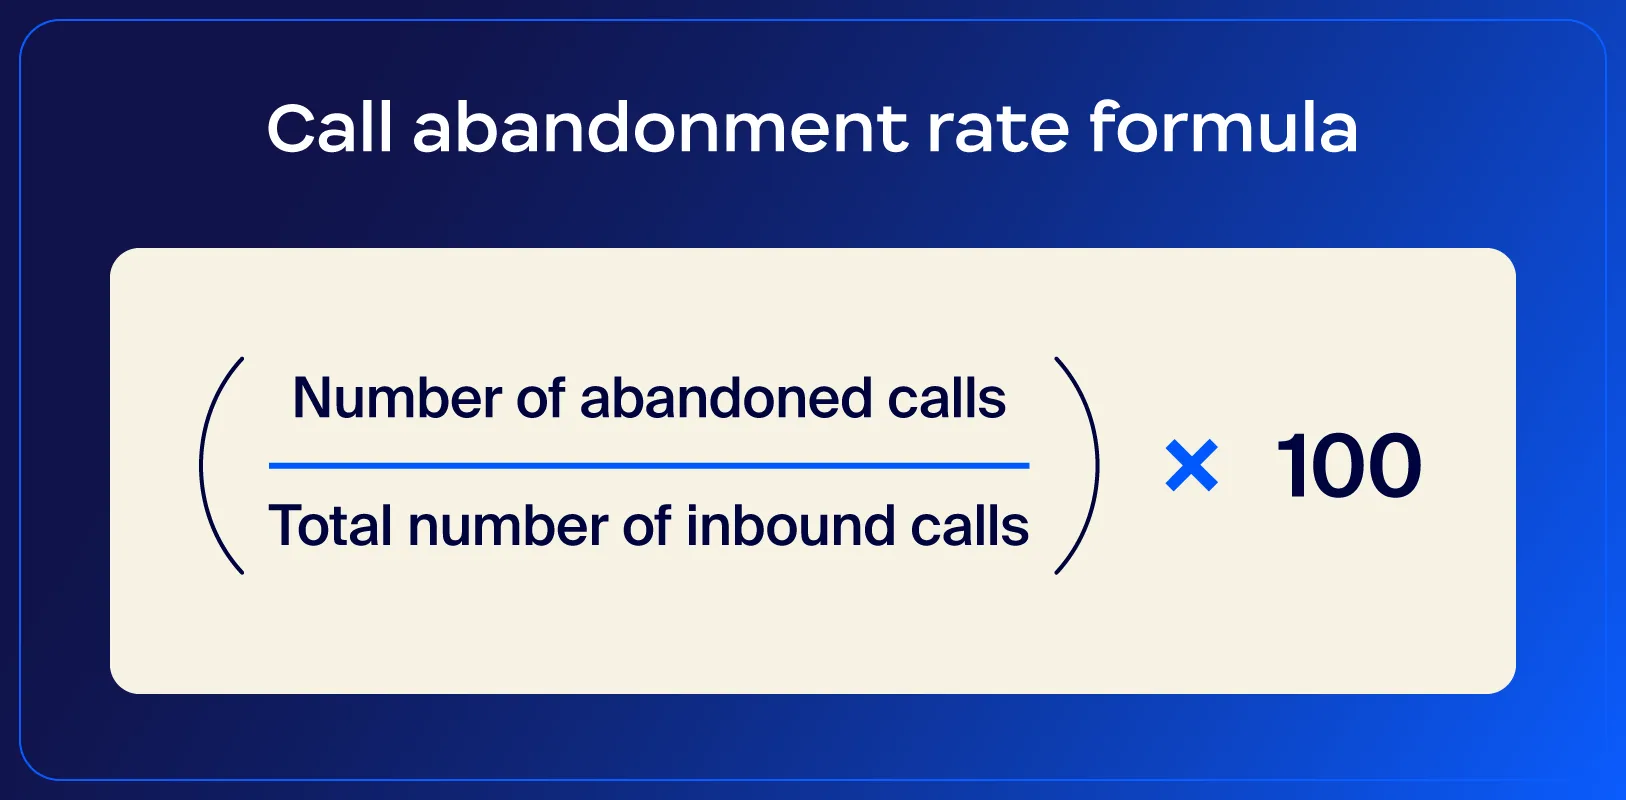
The call abandonment rate measures the percentage of calls that customers disconnect from before an agent can answer. It helps you understand how often customers give up waiting in queues due to long wait times or a lack of available agents.
If your call center has a high call abandonment rate, it typically means that your contact center struggles to handle call volume efficiently.
Tip to improve call abandonment rate: Implement a callback option so customers don’t have to wait in long queues, giving them the flexibility to be contacted when an agent becomes available.
Agent effort score reflects your agents’ level of effort to meet customer needs, resolve issues, and conduct their work. It measures how easy or difficult agents find their day-to-day tasks and how well they handle customer interactions.
A low AES indicates that agents have the necessary tools, resources, and support to be efficient in their roles. In contrast, a high AES indicates they face challenges that affect their performance or their ability to help customers with their queries.
AES helps you spot areas where agents need more support or training. Keep in mind that high effort often leads to burnout, which in turn impacts productivity and retention.
Tip to improve AES: Regularly gather agent feedback to pinpoint workflow obstacles and dig into common hurdles.
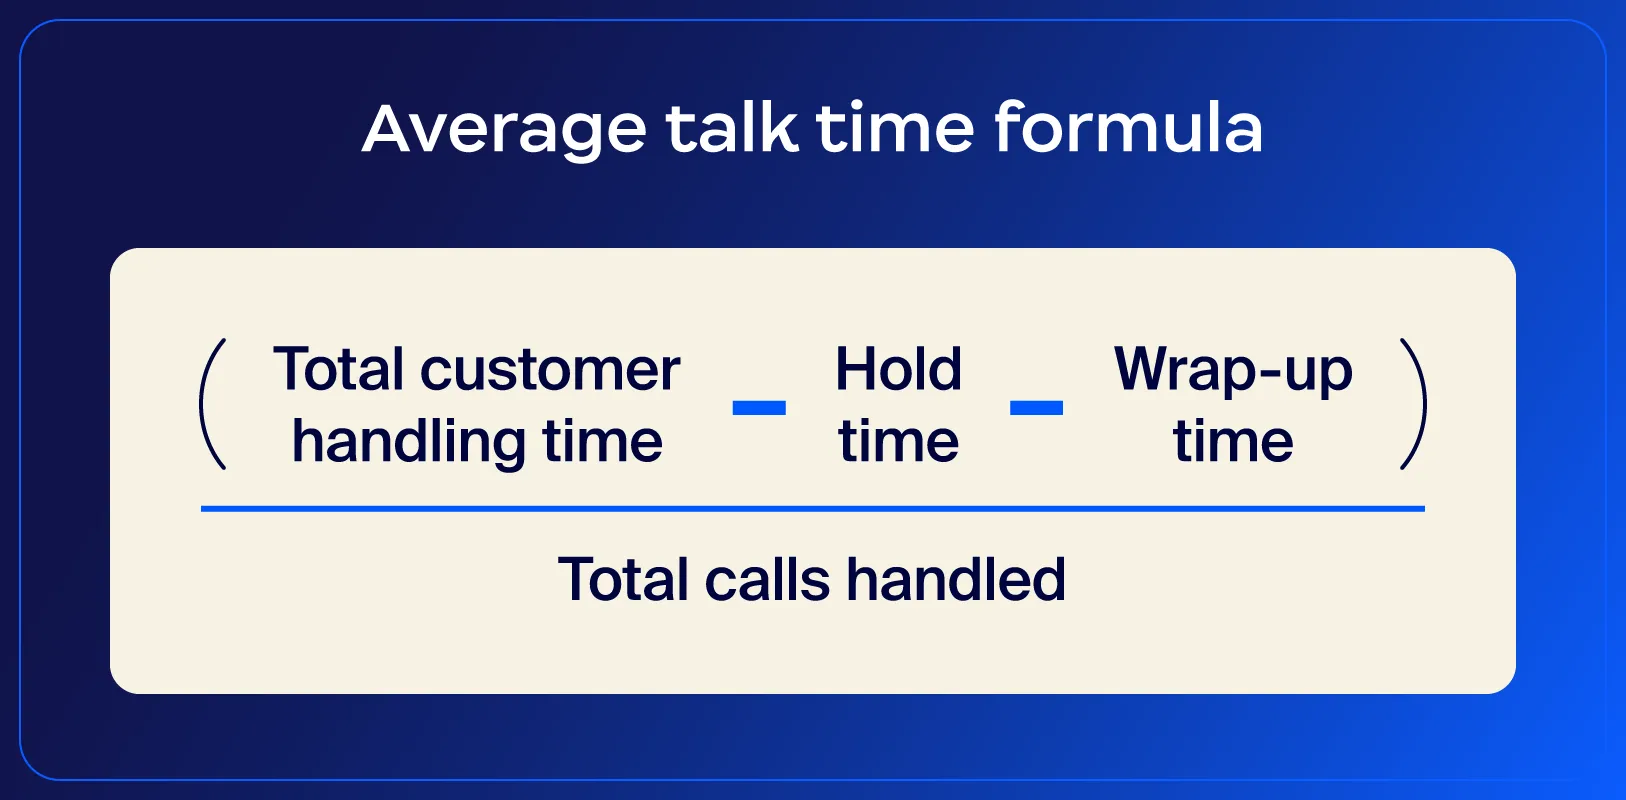
Average talk time is the time agents spend actively speaking with customers during a call. Track your call center’s average talk time so managers can balance efficiency with quality, meaning agents aren’t rushing through calls at the expense of customer experience.
Tips to improve average talk time:
Average speed of answer, sometimes referred to as average wait time, is the average time it takes for an agent to answer a customer’s call once it’s in the queue. It measures how quickly your team can respond to incoming calls.
A low ASA is a positive indicator, indicating that customer calls are being handled quickly and that the risk of call abandonment is lower. To calculate ASA, add up the total waiting time for all answered calls and divide it by the total number of calls handled.
Tracking this metric helps you evaluate whether your staffing levels, call routing strategies, and queue management are configured effectively to enable lower wait times.
Tip to improve ASA: Offer self-service options for common inquiries to reduce call volume, allowing agents to address complex issues faster.
Active waiting calls show the number of customers currently waiting in the queue for any given agent. It provides immediate visibility into call volumes and wait times. Using this real-time metric, managers and leaders can better understand demand and monitor how effectively the team manages incoming calls.
It also helps you pivot in real time, reallocating agents or adjusting call routing to reduce queue lengths. Keeping your active waiting call number low helps maintain a steady and manageable call flow.
Tip to improve average wait time for calls: Implement an option for customers to request a callback, reducing real-time queue pressure.
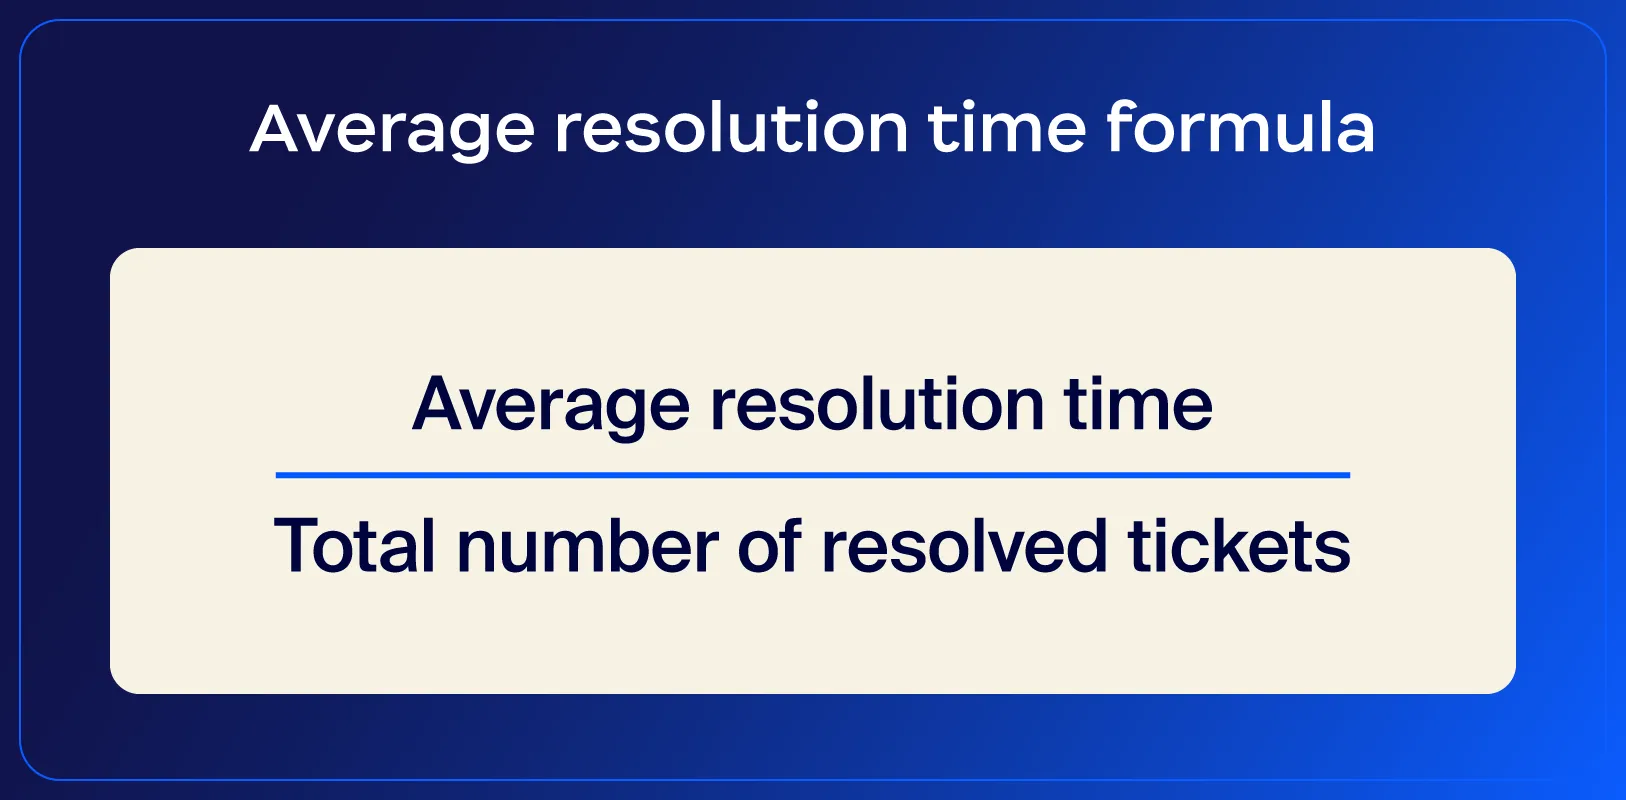
Average resolution time measures the typical amount of time it takes to fully resolve a customer’s issue from the moment of initial contact. It’s measured by dividing the total resolution time for all tickets solved in a specific time frame by the total number of tickets solved in that same time frame.
Total resolution time is the time it takes to fully resolve a customer’s issue, from initial contact to final resolution. It differs from the average resolution time in that it covers all touchpoints, including follow-up calls, escalations, and any additional actions required to close a customer query.
A low average resolution time suggests that your team is efficiently handling inquiries and providing customers with the answers they need quickly. On the other hand, a high average resolution time means calls are taking longer than they should or that customers aren’t walking away with the answers they need on first contact.
Tip to improve average resolution time: Use clear escalation pathways and empower agents with decision-making authority to minimize back-and-forth and speed up resolutions.
Agent performance metrics help you assess agent productivity, responsiveness, and quality of service, allowing you to pinpoint strengths and areas for improvement.
Alongside these metrics, you can leverage Zoom Contact Center’s voice analytics features to assess agent performance better and provide de-escalation suggestions in real time.
A fairly easy metric to track, calls answered per hour measures the average number of calls an agent or team handles within an hour. This is a productivity metric above all else, but it’s also useful for identifying bottlenecks that may be slowing response times.
To put it in perspective, if you optimize your calls answered per hour, you’re effectively increasing service capacity without compromising call quality.
Tip to improve calls answered per hour: Use call routing to direct simpler inquiries to available agents, maximizing efficiency.
Call availability refers to the time agents are available to take calls, as opposed to being occupied with another call or other tasks. The time agents spend filling out paperwork, handling administrative tasks, and performing other duties isn’t factored into call availability calculations.
High call availability means your agents are frequently accessible to customers. This directly translates to lower wait times and faster resolutions. Low availability means your agents are spending too much time on non-call-related tasks, or that it’s time to hire more agents to keep up with call volume. Track this metric to uncover bottlenecks in your employees’ tasks and schedules.
Tip to improve call availability: Align staffing with call volume patterns, scheduling additional agents during peak times.
Missed and declined calls are measured by tracking the number of incoming calls that an agent doesn’t answer. Whether they’re unavailable, busy with other tasks, or intentionally declining the call, you can see exactly how many customer calls are slipping through the cracks.
You can use this metric to identify exact times when call demand exceeds agent availability, enabling you to adjust call routing and staffing accordingly.
Tips to improve missed and declined calls:
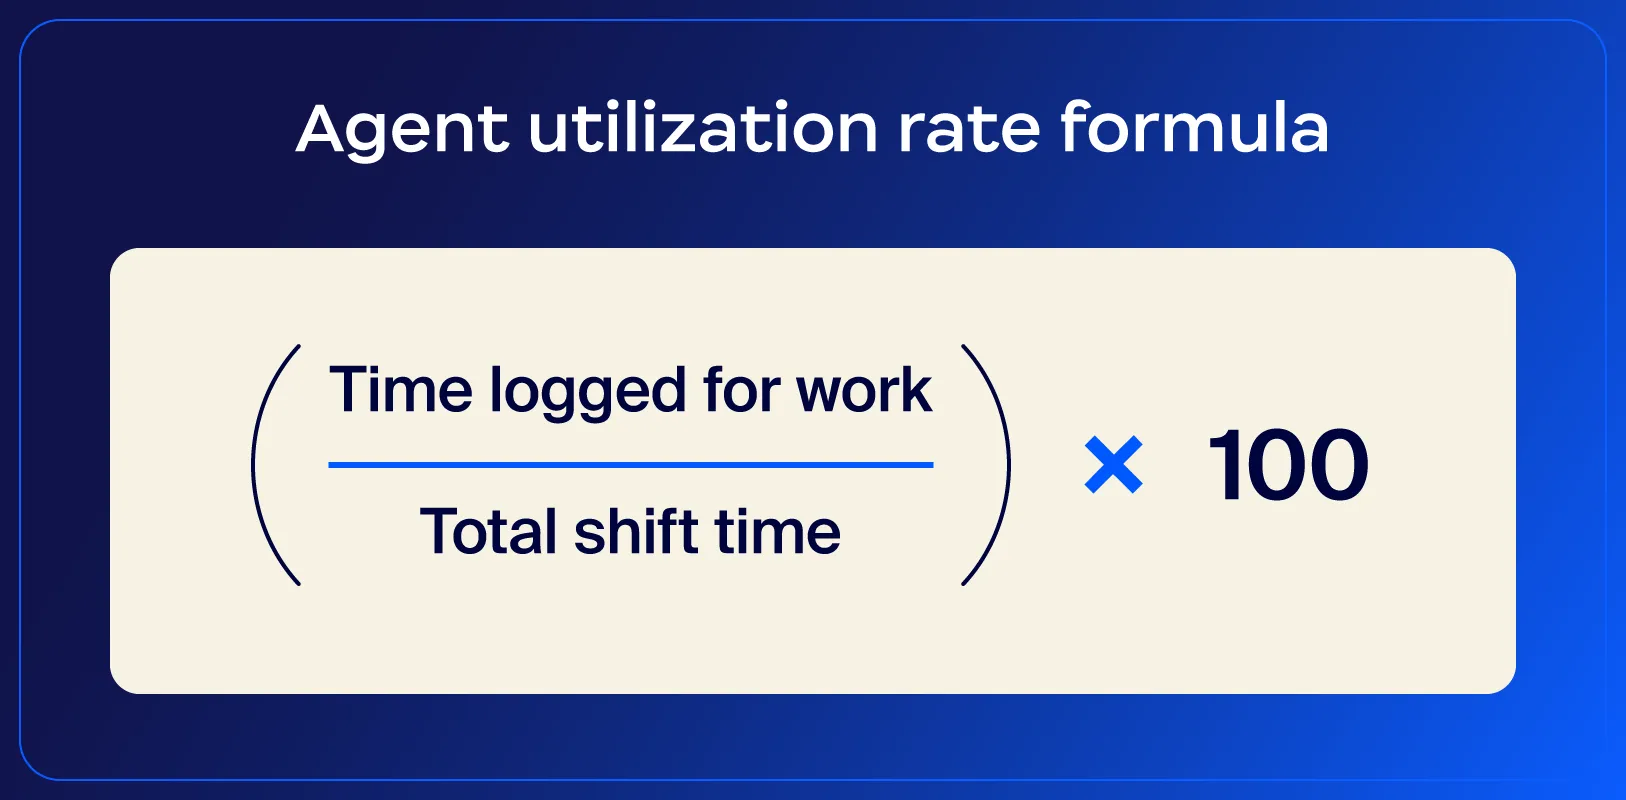
Agent utilization rate measures the time your team spends handling calls or other tasks, rather than being idle while waiting for a call to answer.
This percentage helps measure agents’ time management and productivity. A high utilization rate means your agents are consistently engaged, whether it’s through a call or other form of work. A low utilization rate means time could be better allocated, or you may be overstaffed for your needs.
Tip to improve agent utilization rate: Optimize scheduling to fit peak call time demands and implement CRM tools to reduce handle times and increase productivity.
Types of calls handled tracks the categories of calls agents manage daily. For example, categories might include inquiries, complaints, technical support, and sales.
This metric matters because it clarifies the nature of a call center’s call volume so you can prepare for expected concerns, reallocate resources, and work on agent specialization or training needs.
The metric can also be used to develop targeted support endeavors. For example, if technical support calls are high, consider additional training or specialized support teams.
Tip to improve types of calls handled: Implement specialized teams or outsource complex call types to streamline handling.
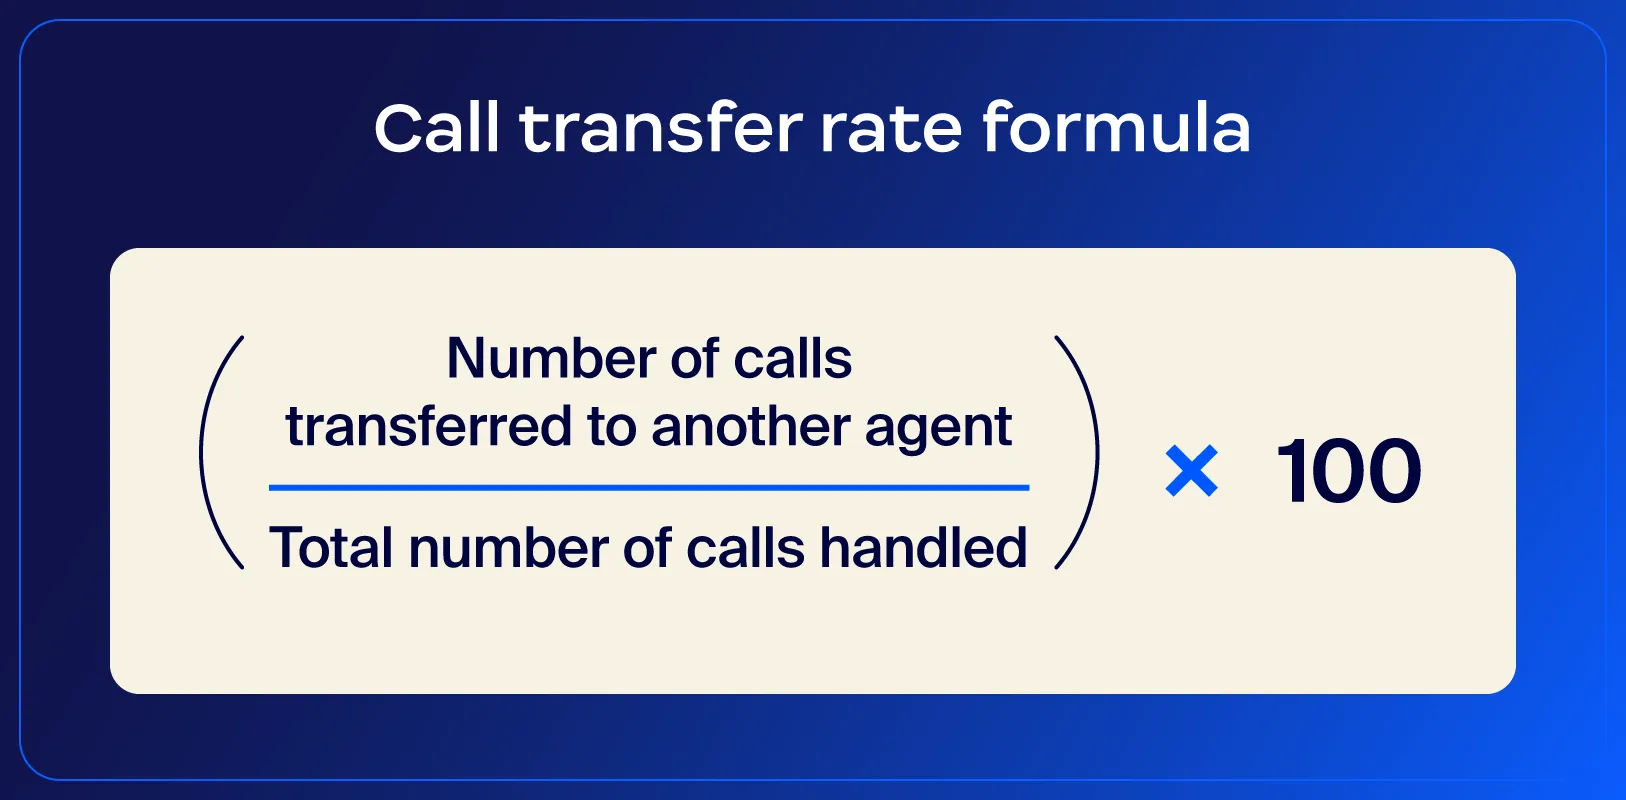
Call transfer rate is the percentage of calls that are transferred from one agent to another.
A high transfer rate can stem from routing issues, gaps in agent training, or inadequate messaging that leads customers to the wrong support department. A low transfer rate indicates agents are able to resolve issues on their own without external assistance from a more experienced agent or manager.
Regardless of the cause, as customers are bounced between agents instead of having their issues resolved, your support quality and customer experience suffer. Monitor your call transfer rate to identify where you need to make call routing improvements or implement additional agent training.
Tips to improve call transfer rate:
Average handle time is the average time an agent spends on a call, including talk time, hold time, and after-call tasks. It’s a key efficiency metric that helps you spot complex queries and training gaps.
A low AHT means quicker resolutions and shorter calls, while a high AHT means longer call durations. It’s important to balance the average handle time with quality — shorter times shouldn’t negatively affect the customer experience.
Tips to improve AHT:
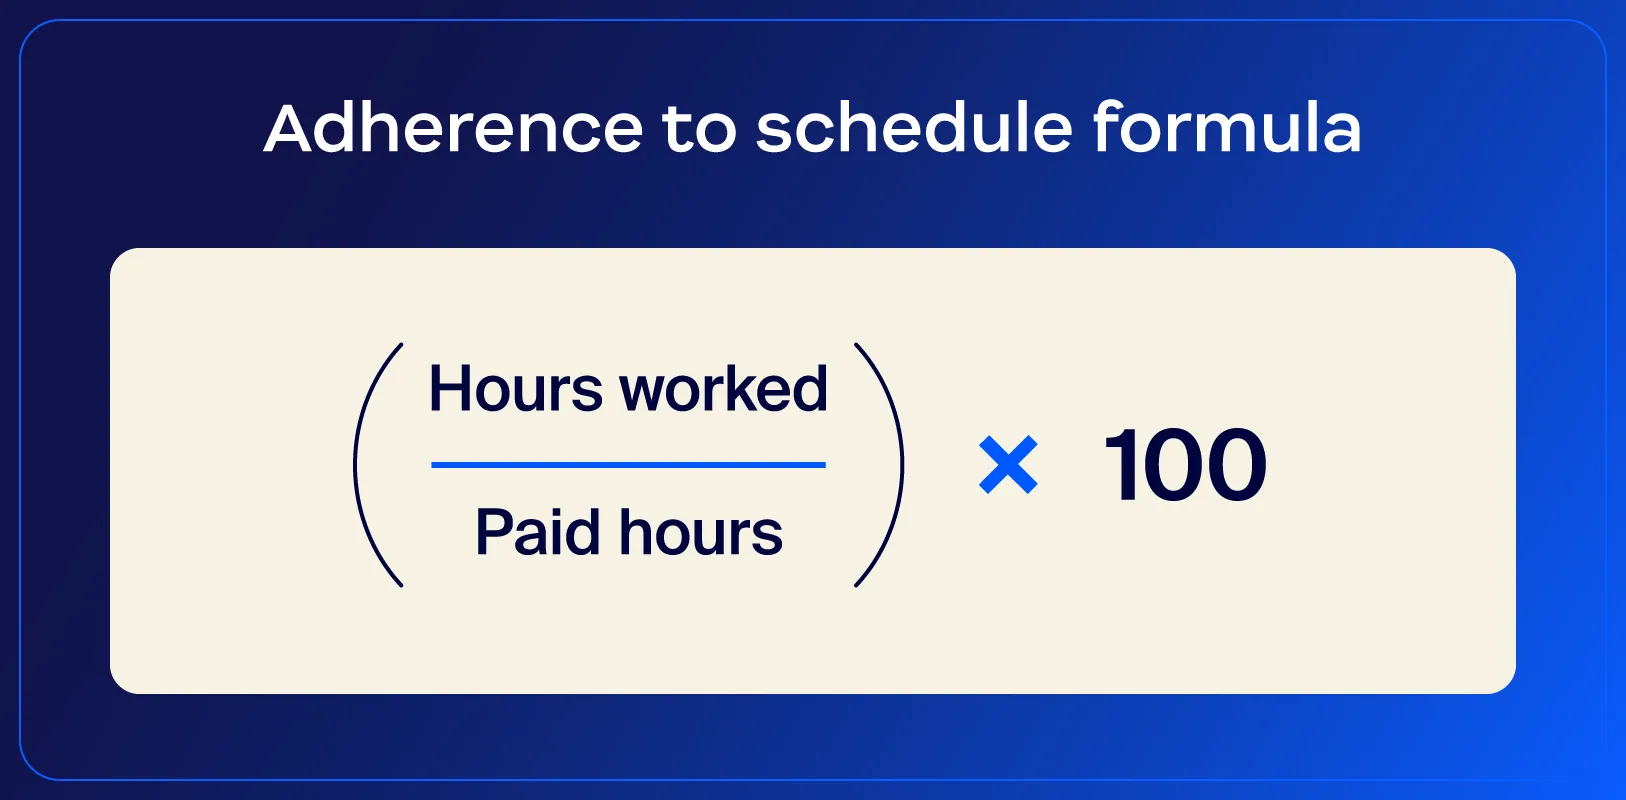
Adherence to schedule is a metric that measures how closely agents stick to their assigned shifts, breaks, and schedules.
High adherence means agents are available when expected, while low adherence can lead to turbulent staffing during peak hours.
Monitor this metric to pinpoint patterns and barriers that are hindering your agents’ adherence to schedules.
Tip to improve adherence to schedule: Use scheduling tools to create realistic, balanced shifts that support agent productivity.
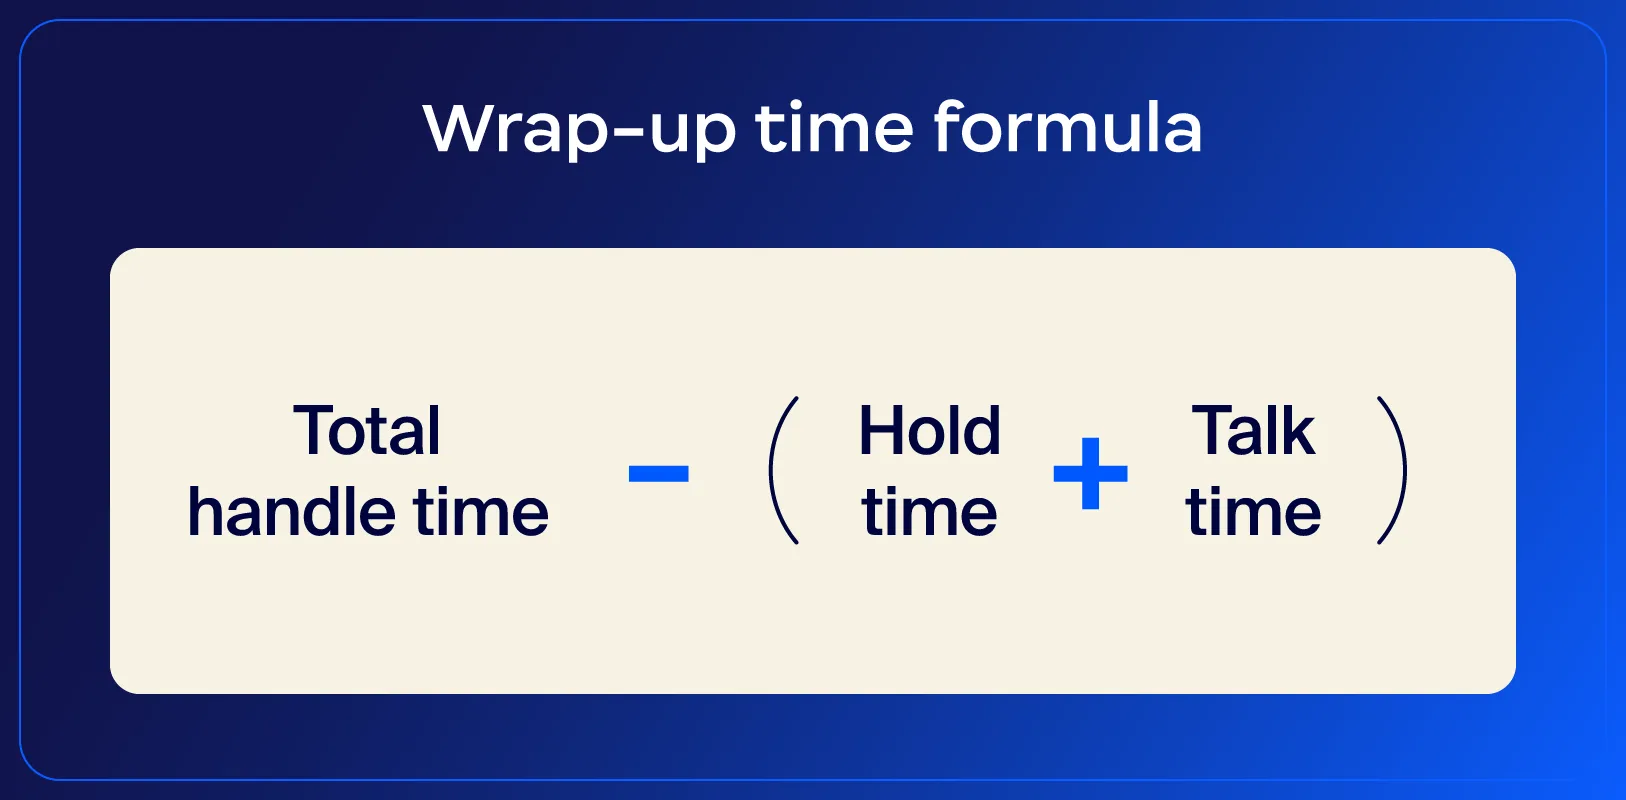
Wrap-up time, or after-call work, is the time agents spend handling tasks related to a call after it ends, such as updating records, documenting outcomes, or scheduling follow-ups.
A low wrap-up time means agents can efficiently handle post-call tasks, whereas a high wrap-up time may indicate complex, time-consuming post-call processes.
Tips to improve wrap-up time:
Here, we’ll dive into KPIs and metrics for contact center operations as a whole so that you can analyze your business performance from a big-picture perspective.
First call resolution rate measures how often agents resolve customer problems with a single contact. Customers tend to prefer having their issues resolved quickly and without having to call back, so a higher first-call resolution rate is generally better.
Managers can use this metric to gauge service performance and identify coaching opportunities to improve customer satisfaction and reduce costs associated with repeat calls.
Tip to improve first-call resolution rate: Equip agents with the customer data and AI augmentation tools they need to resolve issues completely on the first call.
Call arrival rate tracks the volume of incoming calls over a specific period, making it a key metric for understanding demand patterns and peak times. It also allows managers to optimize staffing and resource allocation to make it more likely that enough agents are available during high-traffic periods.
A mismatch between call arrival rate and staffing generally leads to long wait times and a drop in customer satisfaction.
Tip to improve call arrival rate: Use historical data to predict peak times and adjust staffing accordingly.
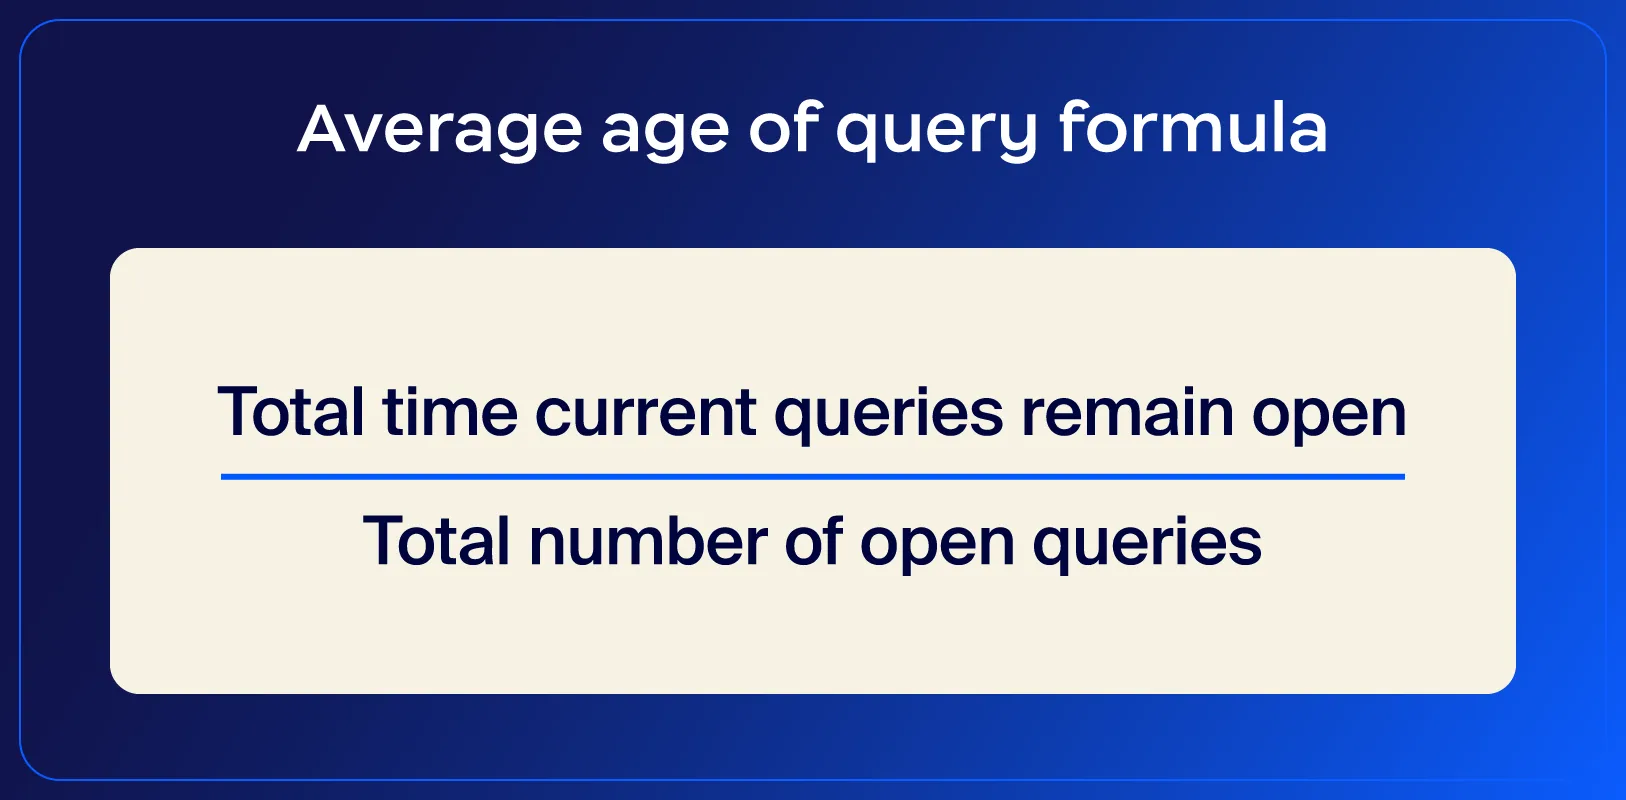
The average age of query measures the time it takes to resolve customer queries, from the moment they’re created until they’re closed. Using this metric, you can identify backlogs or delays in addressing customer issues and tweak your response efficiency.
Contact centers need to track this metric to proactively manage unresolved queries, help their teams prioritize older cases, and streamline response processes to keep resolution times low.
Tips to improve the average age of query:
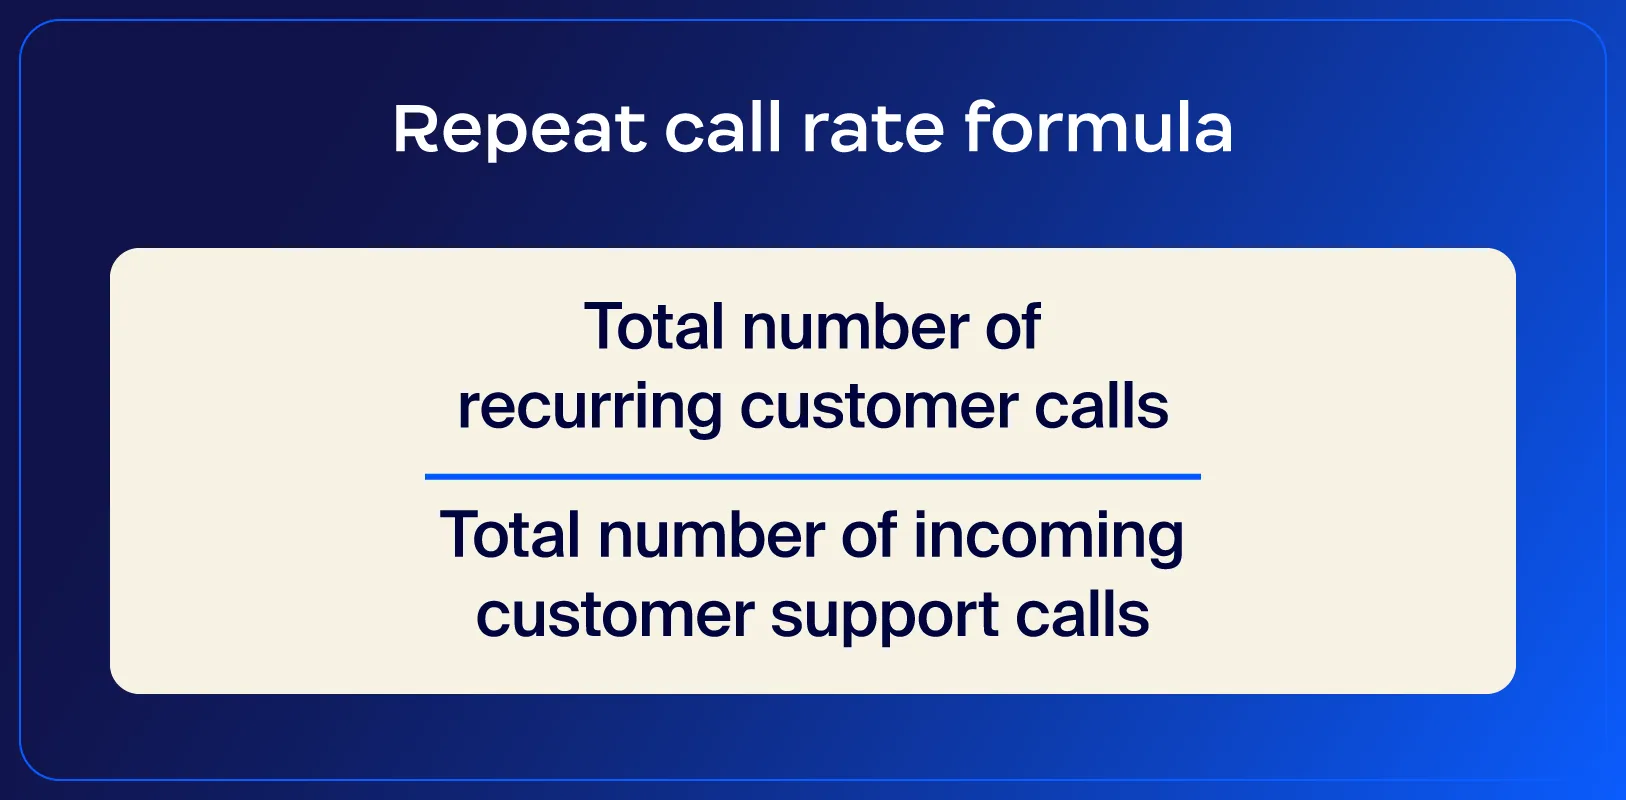
Repeat call rate calculates the percentage of customers who call back about the same issue within a set period of time.
A high repeat-call rate indicates that many issues are not fully resolved during the first interaction. It’s a direct line to customer frustration and increased call volume. A low repeat-call rate means customers aren’t calling back with the same issue, and their needs are generally met during the first call.
Tracking repeat call rates helps reveal common issues that need better solutions or more thorough handling by agents. You can use this to improve agent training so they’re ready for common and recurring issues.
Tips to improve repeat call rate:
Calls handled is a straightforward metric that counts the number of calls an agent or team successfully closes within a given period. It helps determine workload distribution, individual agent productivity, and your contact center’s capacity.
If your calls handled metric is high, this means your call center is managing calls efficiently, while a low number can indicate staffing shortages or problems with call handling.
For example, a low number of calls handled may be due to agents taking too long to resolve each call. This might be because they don’t have quick access to certain resources, or workloads aren’t balanced across the team.
Tip to improve calls handled: Streamline workflows and equip agents with quick access to resources to reduce handling time.
Callback rate is the percentage of customers who opt for a callback rather than waiting on hold. Since many customers appreciate the flexibility of not having to remain on the line, this metric is a good way to assess a contact center’s responsiveness to customer preferences.
For example, if the callback feature is used frequently, it suggests customers trust the system and find it convenient, whereas low usage may be due to low awareness or a preference for direct call handling.
This metric can help you optimize your callback options so they’re easily accessible, clear, and available during peak hours.
Tip to improve callback rate: Promote the callback option clearly in your IVR so customers know it’s available.
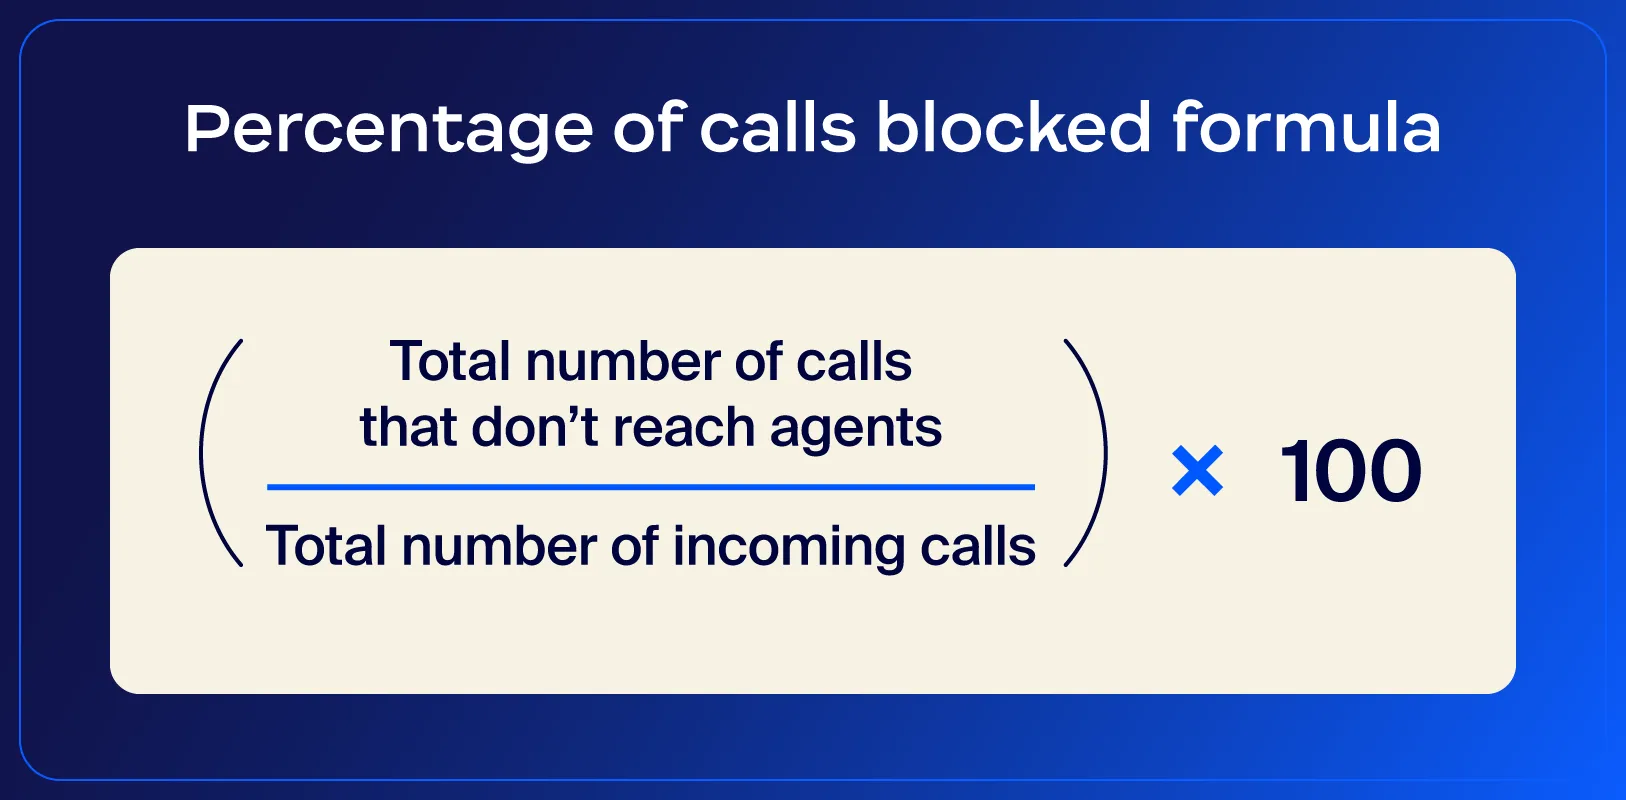
“Calls blocked” in this context doesn’t refer to calls that were rejected. The metric refers to incoming calls that cannot be connected due to capacity limitations, such as occupied lines.
If your call blocking rate is high, it could mean your call center doesn’t have the resources to handle the current call volume. Keeping this percentage low helps make your agents more accessible when customers need help.
Tips to improve the percentage of calls blocked:
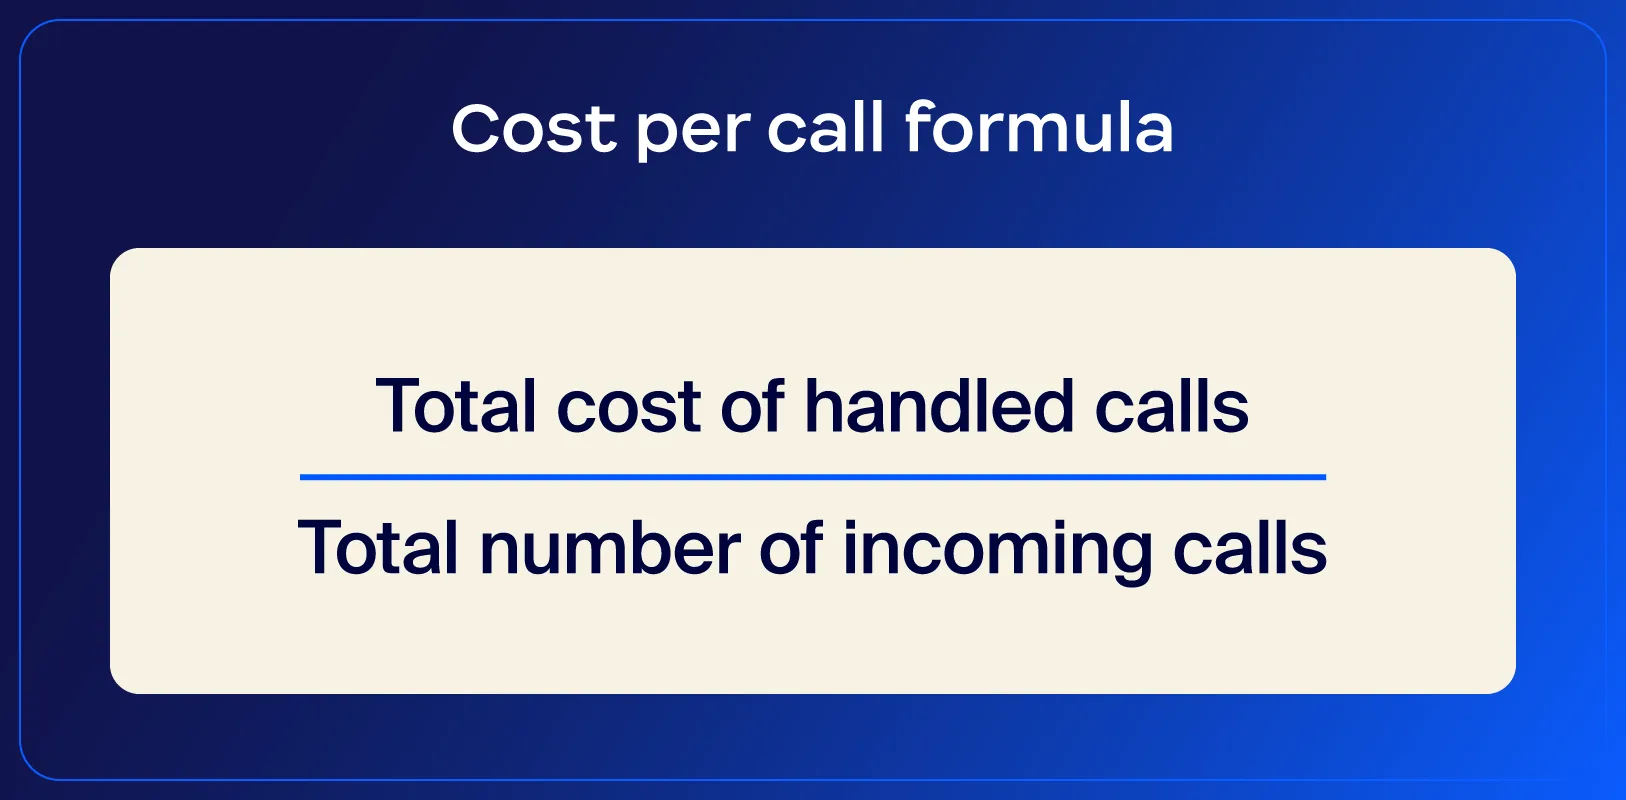
The cost per call calculates the average cost of each handled customer call. This takes into account related operational costs, such as agent wages, tech costs, and overhead.
CPC gives you insight into your financial performance and cost-effectiveness. The goal is to maintain a low CPC by improving resource management and streamlining processes. This helps your contact center balance quality and cost while optimizing operations to provide excellent service without breaking the bank.
Tip to improve CPC: Implement automation and self-service options to reduce the number of handled calls and operational costs.
Employee satisfaction measures how content and motivated employees feel. Keeping employee satisfaction high is important for maintaining morale, reducing turnover, and making sure agents deliver high-quality service.
The alternative is dealing with turnover and disengagement, which can hurt your contact center’s customer interactions and team performance.
Tips to improve employee satisfaction:
The agent turnover rate measures the percentage of customer service agents who leave a company over a given period. High agent turnover indicates that agents are unsatisfied with their roles and may point to failures in providing a strong employee experience. Low agent turnover usually indicates the opposite and may point to strong employee satisfaction.
Tips to improve agent turnover rate:
In this section, we’ll dive into the metrics that call centers use to measure the effectiveness of their AI solutions, including agents, customer service chatbots, and suggestion tools.
Bot containment is the percentage of interactions that a virtual agent successfully handles without the help of a live agent. A higher containment rate generally means that your bot is successfully performing the function you’ve built it to do.
Agent-assist tools can now guide agents during an interaction by surfacing insights from a knowledge base or by providing recommended next-best actions. But, how do you know if the agent is actually following those recommendations? AI adherence helps measure whether or not your agents are following along. If you have a low adherence rate, it could mean your LLM or knowledge base needs refining, or your agents need more training.
Another important metric for CX leaders to track is agent AI feedback, which provides insight into whether AI is making sensible recommendations. As LLM models continue to be refined, you must be soliciting feedback from agents, the team members who AI most impacts. By doing this, you can build more helpful agent assistants.
This feedback may come in the form of a simple thumbs up or down, or a rating from 1 to 5.
Escalation rate, also known as handoff rate, is the rate at which the first point of contact (often an AI agent) reroutes interactions to another customer service representative (typically a human).
A high AI-to-human escalation rate can mean several things. For example, if simple issues are consistently being escalated, it may indicate performance or knowledge gaps in your AI agents. However, it can also indicate that customers often call with complex queries that require nuance only a human agent can deliver.
Intent recognition accuracy measures how accurately an AI solution understands the intent behind a customer’s written or verbal request. High accuracy typically leads to higher first-call resolution rates and improved customer satisfaction, as the AI knows how to either respond to the query accurately or route it to the appropriate human agent.
Having an eye on these metrics isn’t enough on its own. As these metrics provide insight into your call center’s current state, you’ll need to adjust accordingly to avoid sacrificing service quality.
Set realistic, achievable customer service goals to give your team clear targets. Goals should be based on both customer expectations and operational benchmarks so your agents can focus on what really matters: the customer. Start by choosing a set of metrics to track, beginning with the basics (CSAT, NPS, QA) and any metrics that address issues your call center is experiencing.
Data-driven decisions help you base changes on actual performance rather than assumptions. Use existing performance and customer feedback data to make targeted changes that impact your contact center across the board.
For example, you might analyze key metrics such as call abandonment rate and repeat call rate to pinpoint issues and prioritize improvement efforts.
Use metrics to highlight areas for additional training or coaching. For example, first contact resolution is a metric that can help you design tailored coaching sessions to address specific skill gaps. It makes for a much more targeted approach that helps agents develop the skills they may be missing.
Monitor progress toward metric-based goals to keep your team aligned and allow you to course-correct quickly. You can reveal trends, measure the impact of new initiatives, and highlight areas for further improvement or training.
Frequent assessments can also be a great opportunity to recognize agent achievements and boost morale.
Make use of modern call center technology for features like intelligent call routing, automated reporting, and real-time analytics. Solutions like Zoom Contact Center offer comprehensive tools to help manage call volumes, streamline workflows, and equip agents with essential information in real time.
With features like AI-powered call routing and integration with popular CRM systems, Zoom Contact Center enables agents to handle queries with all the tools they need and an intelligent AI-powered assistant at their disposal.
Zoom Contact Center provides in-depth analytics and tracking tools, empowering you to monitor essential KPIs like average handle time, first contact resolution, and customer satisfaction scores.
With customizable call center dashboards and real-time insights, our software provides a broad view of performance, enabling you to quickly identify trends, optimize processes, and make data-driven decisions.
Discover how Zoom Contact Center can elevate your operations and enhance your customer experience.
*Net Promoter®, NPS®, NPS Prism®, and the NPS-related emoticons are registered trademarks of Bain & Company, Inc., NICE Systems, Inc., and Fred Reichheld. Net Promoter ScoreSM and Net Promoter SystemSM are service marks of Bain & Company, Inc., NICE Systems, Inc., and Fred Reichheld.


