
Meet Zoom AI Companion, your new AI assistant!
Boost productivity and team collaboration with Zoom AI Companion, available at no additional cost with eligible paid Zoom plans.
Updated on April 10, 2025
Published on April 10, 2025


Imagine this: You're in a hurry, your phone battery is dying, and you need to quickly resolve an issue with your internet service. You call customer support, only to be met with endless automated menus, long hold times, and multiple transfers before finally reaching a representative. This frustrating experience is exactly what a customer effort score (CES) aims to prevent.
CES is a key contact center metric that measures how easy it is for customers to do business with you, which can directly impact your bottom line. Studies show that 96% of customers with a low-effort experience intend to repurchase, compared to only 9% of those with a high-effort experience.
This article will delve deeper into what a CES is, why it’s so important for call centers, and actionable strategies and best practices for measuring and improving it.
Customer effort score is a simple yet powerful performance metric that measures how much effort customers have to exert to achieve their goals when interacting with your company. This could include actions like:
CES is a valuable business tool because it directly correlates with customer loyalty. When customers believe that interacting with your company requires a lot of effort, they are more likely to switch to a competitor. Understanding and improving your CES can help you significantly reduce customer churn, increase customer satisfaction, and build stronger long-term relationships.
|
Metric |
Measures |
Question examples |
|
Customer effort score (CES) |
How much effort customers exert to achieve their goals when interacting with a company |
How difficult was it to complete the necessary forms or documentation? |
|
Net promoter score (NPS)* |
Customer loyalty and the likelihood of recommending a company to others |
How likely are you to recommend a company to others on a scale of 0 to 10? |
|
Customer satisfaction (CSAT) |
Overall customer satisfaction with a specific interaction or experience |
How satisfied are you with our service today? |
CES, Net Promoter Score® (NPS), and customer satisfaction (CSAT) are all valuable customer experience metrics, but they focus on different aspects.
By combining these metrics, businesses can gain a comprehensive view of the customer experience and identify areas for improvement across all touchpoints.
Businesses typically use a customer effort score survey to measure CES. These surveys usually include a single core question, such as:
"On a scale of 1 to 5, where 1 is Very Difficult and 5 is Very Easy, how easy or difficult was it to achieve your goal today?"
CES surveys are administered immediately following a customer interaction to capture customer feedback while their experience is still top of mind.
CES surveys are simple, but you do have a few different options for structuring them based on the type of customer feedback you want:
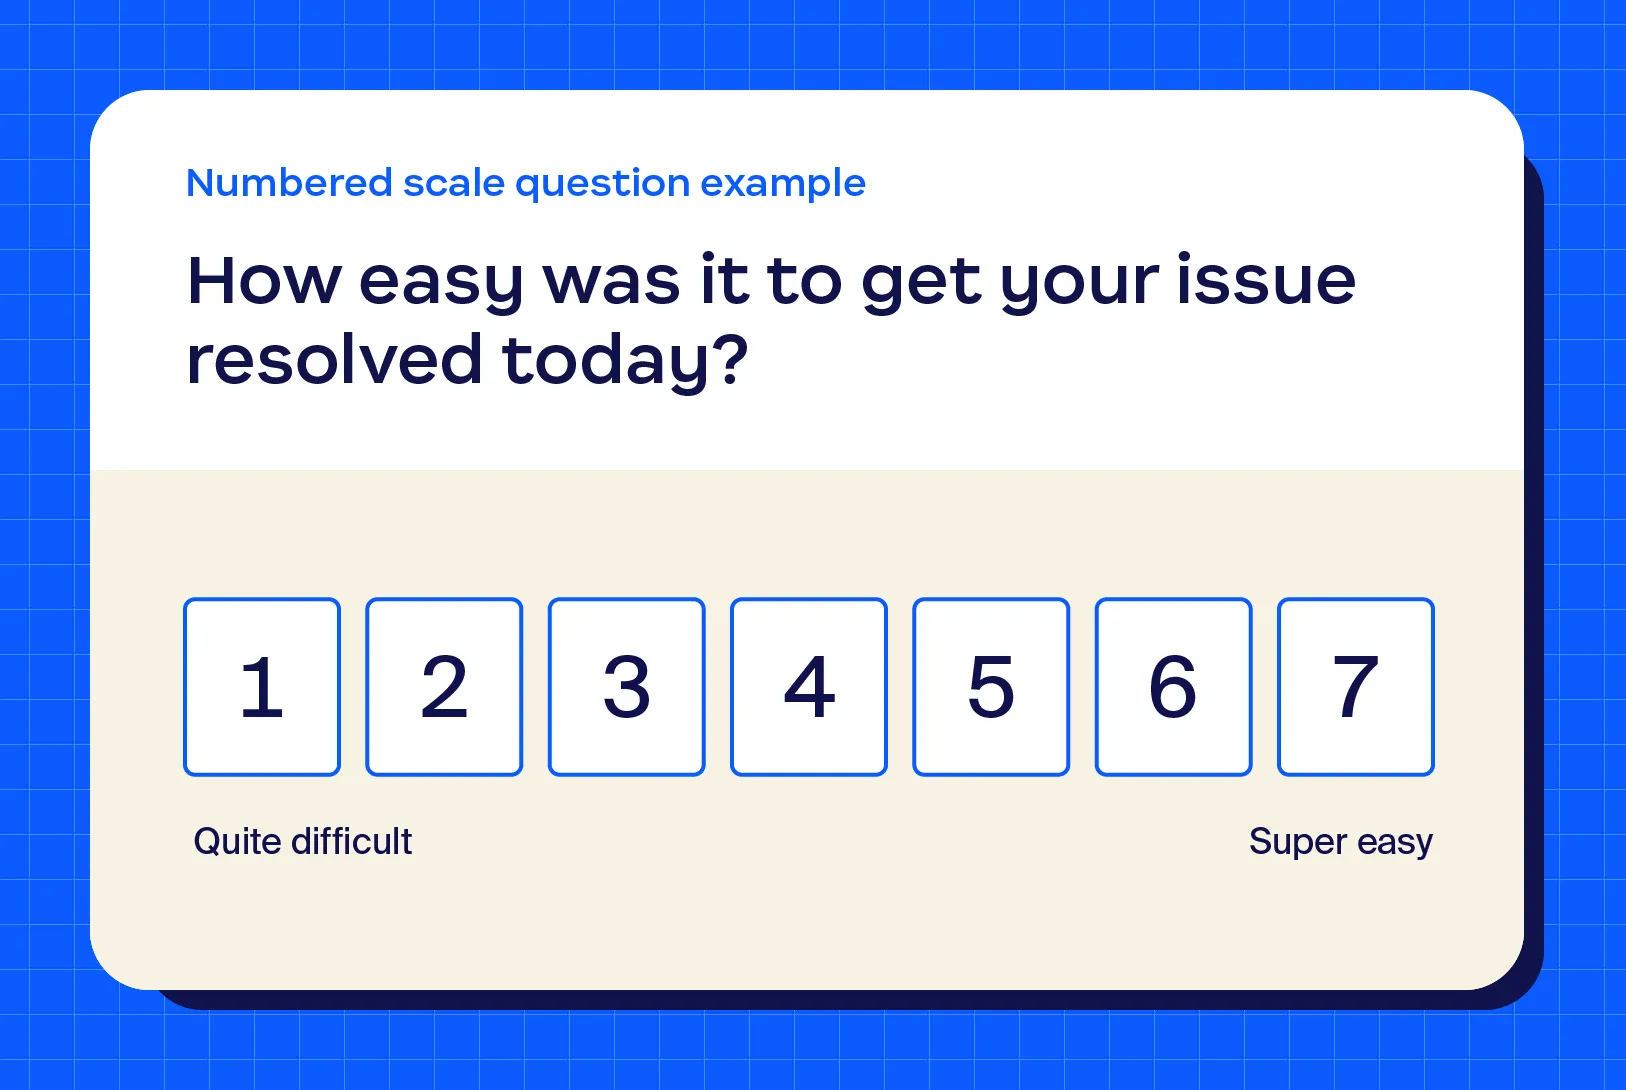
This is the most common type of CES survey question. It uses a numerical scale (usually 1–7 or 1–10) where 1 represents the lowest effort (“Very Easy”) and the highest number represents the highest effort (“Very Difficult”).
Example customer effort score questions:
To calculate: Add all your responses together and divide them by the number of respondents to get your average. The higher your average, the better your CES.
For example, let's say you surveyed 5 customers about their recent experience with your company, using a 5-point scale where 1 represents "very difficult" and 5 represents "very easy." Here's how you would calculate your CES:
To calculate your CES, you’d add up the sum of all your responses and divide by the number of your respondents.
CES = (4 + 3 + 5 + 2 + 5) / 5
CES = 19 / 5
CES = 3.8
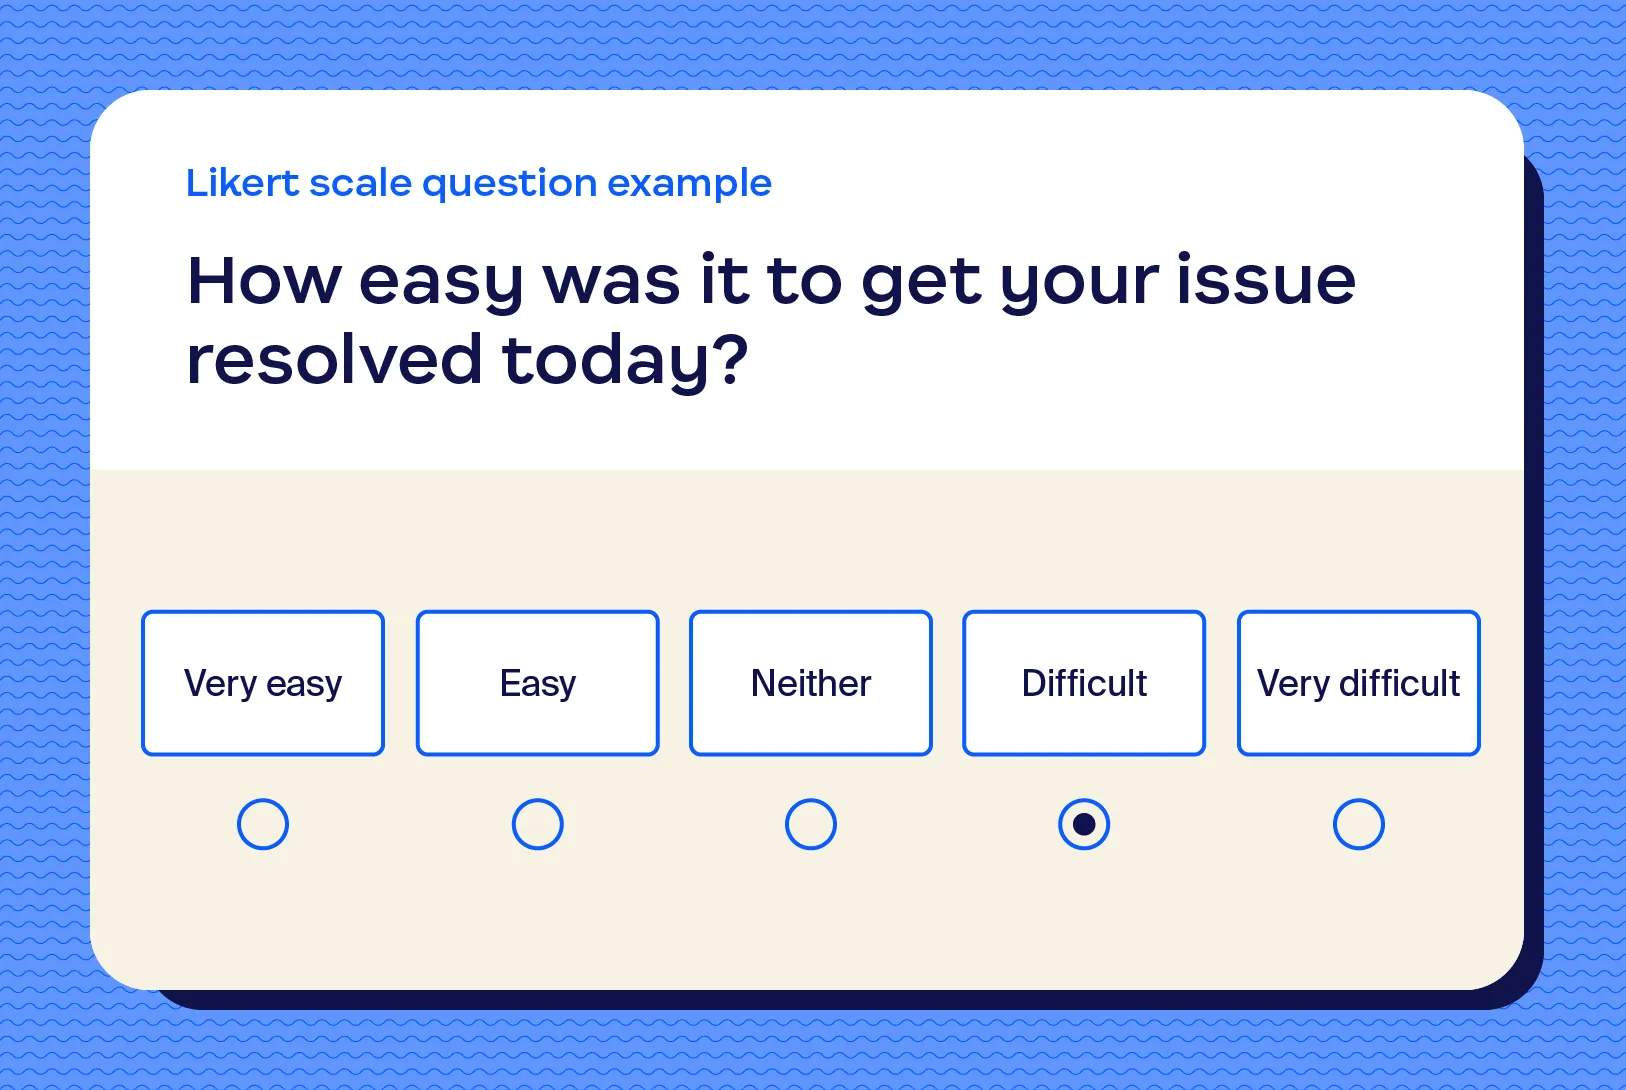
A Likert scale is a type of rating scale that measures opinions or attitudes. It presents a statement or question and offers a range of answer options, usually five or seven, that express varying levels of agreement or disagreement.
For example, a typical Likert scale might include options like:
This allows respondents to indicate their level of agreement or disagreement with the statement in a more nuanced way than simply “yes” or “no.”
Example statements:
To calculate: Assign a number between 1–5 to each answer and calculate your average.
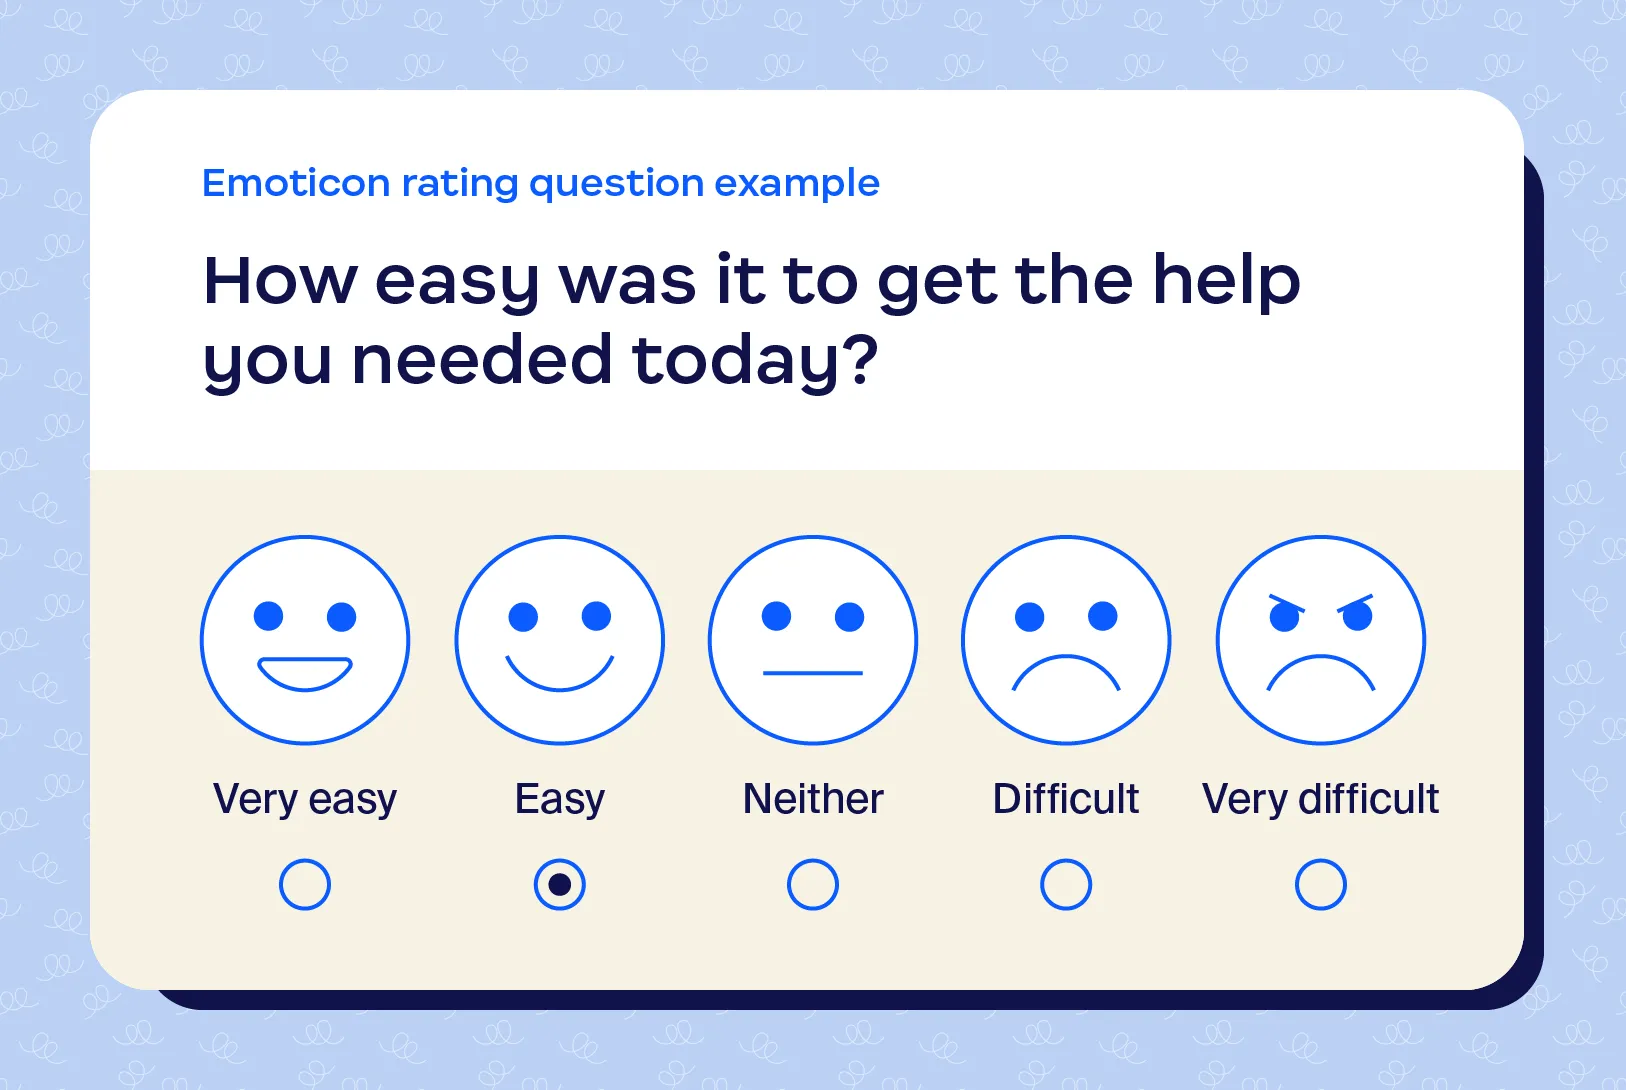
Emoticon ratings are a fun and engaging way to measure CES. Instead of numbers or words, customers can simply select an emoticon that best represents their experience. For example:
This visual approach can make the survey more appealing and easier for customers to complete, especially on mobile devices.
Example questions:
To calculate: Assign a number to each answer and calculate the average.
Analyzing CES feedback goes beyond simply calculating an average score. It involves diving deeper to understand the “why” behind the scores.
Here’s how to get more out of your CES data:
When analyzing CES feedback, it’s important to understand the specific situation. For example, a high effort score for a simple question like “What are your store hours?” might point to a serious problem with your website's search or how you present that information. On the other hand, a high effort score for a complex technical support issue might be more expected.
By looking at each interaction individually, you can pinpoint the real reasons behind customer frustration and find effective solutions.
Tracking CES provides significant payoffs for both businesses and contact centers. By understanding the level of effort customers spend when interacting with your support team, you can identify areas for improvement and enhance the overall customer experience.
Key benefits of tracking CES include:
CES surveys may seem simple, but there is a strategy for creating and conducting surveys that’ll help you get the information you need to improve your processes. Here’s a list of best practices to keep in mind when putting together your CES surveys:
Analyzing customer feedback from your CES surveys will help you pinpoint ways to boost your score — and, in effect, customer satisfaction as a whole. Here are a few ways to make it easier for your customers to get what they need from your business:
Improving your customer effort score isn’t just about making things easier for customers; it’s about building stronger, more profitable customer relationships.
Zoom Contact Center streamlines the customer experience across all channels with features like Zoom Virtual Agent, intelligent chatbots, and omnichannel support.
Request a demo to discover how Zoom can help you improve your CES and deliver exceptional customer service.
A good customer effort score generally falls within the 5–7 range on a 7-point scale, indicating that customers found their interaction with the company relatively easy. However, the ideal CES score can vary depending on the industry, business goals, and customer expectations.
It’s important to track your CES scores over time, identify trends, and compare your performance to industry benchmarks to understand what constitutes a “good” score for your specific business.
Send CES surveys right after a customer interaction, like a phone call or live chat. This way, the customer’s experience is still fresh in their mind, leading to more accurate feedback.
Timing is key for getting the best feedback. Delaying the survey can make it harder for customers to remember the details of their experience.
“High effort” in the context of customer effort score means customers had to work hard to get what they wanted. This could be because they had to wait a long time, deal with confusing menus, or have trouble finding the information they needed.
How often you conduct CES surveys depends on several factors, including industry, interaction volume, and business goals. As a general rule, it’s recommended to conduct CES surveys regularly, such as monthly or quarterly, to track trends and identify areas for improvement.
Integrate CES data with other customer data sources, such as CRM data, NPS scores, and customer demographics, to better understand customer behavior and identify key drivers of customer effort. For example:
To make your CES surveys inclusive, offer them in multiple languages and make sure they are accessible to people with disabilities by designing them to be compatible with screen readers and other assistive technologies. Consider offering alternative survey methods, like phone surveys or in-person interviews, for customers who can’t complete online surveys.
* Net Promoter®, NPS®, NPS Prism®, and the NPS-related emoticons are registered trademarks of Bain & Company, Inc., NICE Systems, Inc., and Fred Reichheld. Net Promoter ScoreSM and Net Promoter SystemSM are service marks of Bain & Company, Inc., NICE Systems, Inc., and Fred Reichheld.


