Zoom Video and Audio Performance Report 2024

Audio and video quality are at the core of the virtual meeting experience. When one or the other is subpar or worse, doesn’t function at all, the user experience is degraded, causing frustration. At Zoom, we always want to know how Zoom Meetings compare to other meeting solutions. So we tasked TestDevLab to compare video and audio quality under a variety of conditions and call types for the following vendors:
- Zoom
- Microsoft Teams
- Google Meet
- Cisco Webex
The findings provided in this report reflect TestDevLab testing results from April 2024.
About TestDevLab
TestDevLab (TDL) offers software testing & quality assurance services for mobile, web, and desktop applications and custom testing tool development. They specialize in software testing and quality assurance, developing advanced custom solutions for security, battery, and data usage testing of mobile apps. They also offer video and audio quality assessment for VoIP or communications apps and products for automated backend API, as well as web load and performance testing.
TestDevLab team comprises 500+ highly experienced engineers who focus on software testing and development. The majority of their test engineers hold International Software Testing Qualifications Board (ISTQB) certifications, offering a high level of expertise in software testing according to industry standards and service quality.
To maintain a fair test across all vendors, all tests were conducted using TestDevLab equipment and accounts. In addition, the individual vendor accounts were kept at a default configuration with the exception of enabling a maximum resolution of HD (1080p) for vendors that default to limiting video resolution.
The testing scenarios included a “Receiver” device, a “Sender” device, and additional devices that acted as additional participants. All devices were connected to the same video call. Depending on the testing scenario, the call layout and network were configured to reproduce the required test parameters.
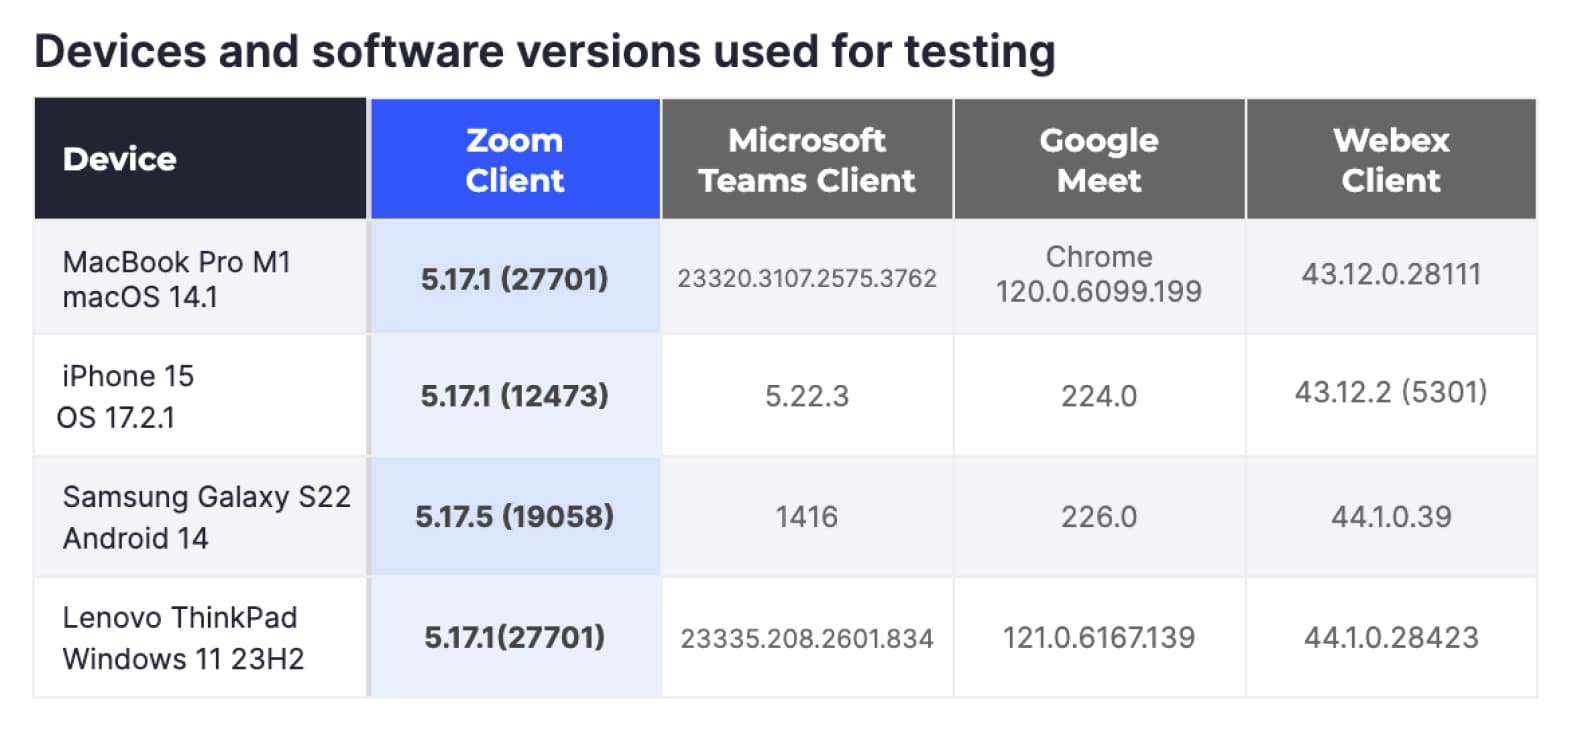
Devices and software versions used for testing
Testing scenarios
To provide an overall picture of video and audio quality in Meetings, we asked TDL to test the most common meeting scenarios, using commonly used hardware.
Variable network scenarios
For these scenarios, we wanted to test how the different platforms react in various network conditions using a few common compute platforms. To achieve this goal, TDL used four common hardware platforms: MacBook Pro computers, Windows computers, iPhones, and Android devices. We configured the most common meeting type with three participants, no shared content, and a presenter/speaker view setting to maximize video resolution.
The network scenarios that were tested included:
- Clean network: No network limitation, used as a baseline.
- Network limited to 1Mbps: Network bandwidth is limited to 1Mbps.
- Network limited to 500Kbps: Network bandwidth is limited to 500Kbps.
- Variable packet loss: The meetings started with 10% packet loss, changed to 20% after 1 minute, and then to 40% after an additional minute.
- Variable latency: Meetings start with no limitation. After 1 minute, 100ms of Latency and 30ms of jitter are introduced for 1 minute. Then latency is increased to 500ms and jitter to 90ms.
- Network recovery: The meetings started with no limitations. After 1 minute, a network issue was simulated that limited bandwidth to 1Mbps, added 10% Pocket loss, and introduced 100ms of latency and 30ms of jitter for 1 minute. Then, it returned to the clean network.
- 3G cellular network: Conducted a video call on 3G cellular Network on mobile devices only.
- Congested network test: The call starts with a clean network, and then, at various intervals, a short burst of high-volume data is sent over the network to simulate a busy network.
Each call lasted for three minutes and was repeated five times. Across all vendors, hardware variations, and network conditions, TDL conducted 420 meetings.
When limitations were placed on a call, they were limited to the tested device acting as a “receiver.”
Variable call type scenarios
For these scenarios, we wanted to test the various call types and technologies used by most users. The hardware used was limited to MacBook Pro M1 and Windows computers. The scenarios included five- and eight-person meetings arranged in gallery mode. TDL tested meetings with participants only, meetings with content sharing, and meetings where participants activated virtual backgrounds.
In all cases, the network remained clean and unrestricted. As before, each meeting lasted three minutes and was repeated five times. Overall, TDL conducted an additional 240 meetings in this category.
Captured metrics
To generate a complete picture of meeting quality, we asked TDL to capture metrics in four major categories related to video and audio quality, network utilization, and resource usage. The metrics were captured every second of the meeting and were saved to a centralized database.
Audio quality
- MOS Score: The Mean Opinion Score (MOS) quantifies call quality based on human user ratings, typically on a scale from 1 (poor) to 5 (excellent), reflecting the perceived audio clarity and overall experience.
- ViSQOL: ViSQOL (Virtual Speech Quality Objective Listener) is an objective metric that evaluates call quality by comparing the similarity between the original and the transmitted audio signals using a perceptual model.
- Audio delay: Audio delay measures the latency between the spoken word and its reception by the listener, with lower values indicating delay and higher call quality.
Video quality
- Frames per second (FPS): Frames Per Second (FPS) measures the number of individual frames displayed per second in a video, with higher FPS providing smoother motion and improved video quality.
- VMAF: Video Multi-method Assessment Fusion (VMAF) is a perceptual video quality metric developed by Netflix that combines multiple quality metrics to predict viewer satisfaction and video quality.
- VQTDL: Video Quality Temporal Dynamics Layer (VQTDL), developed by TDL, assesses video quality by analyzing temporal variations and dynamics, capturing how changes over time impact the overall video viewing experience.
- PSNR: Peak Signal-to-Noise Ratio (PSNR) is a mathematical metric used to measure the quality of a video by comparing the original and compressed video frames, with higher values indicating less distortion and better quality.
- Video delay: Video delay refers to the time lag between the actual live video capture and its display on the remote screen. Lower delays provide a more real-time meeting experience.
- Video freeze: Video freeze measures the frequency and duration of pauses or stalls in the video stream, with fewer and shorter freezes indicating better video quality.
Resource utilization
- CPU utilization measures the percentage of the central processing unit's (CPU) capacity that is being used by the meeting client.
- Memory usage refers to the amount of random access memory (RAM) being consumed by a meeting client.
- GPU utilization measures the percentage of the graphics processing unit's (GPU) capacity that is being used by the meeting client.
Network utilization
- Sender bitrate: the amount of network data being sent from each machine in the meeting
- Receiver bitrate: the amount of network data being received by each machine in the meeting
Not all metrics can be captured on all platforms. For example, not all resource utilization metrics can be captured on mobile devices. TDL maximized metrics capture in each call scenario.
To simplify the presentation of the vast amount of information collected by TDL, we scored each of the above metrics on a 1-4 scale, where 1 is the best score and 4 is the worst. We then totaled the scores from the metrics into the four categories. The lowest totals represent the best quality scores in each category.
This section explores the results at a high level with various filters applied to focus on different call categories. Later, we will focus on individual call scenarios and provide more detailed information on the behavior of the different platforms in those scenarios. See “Detailed Results” for more in-depth information.
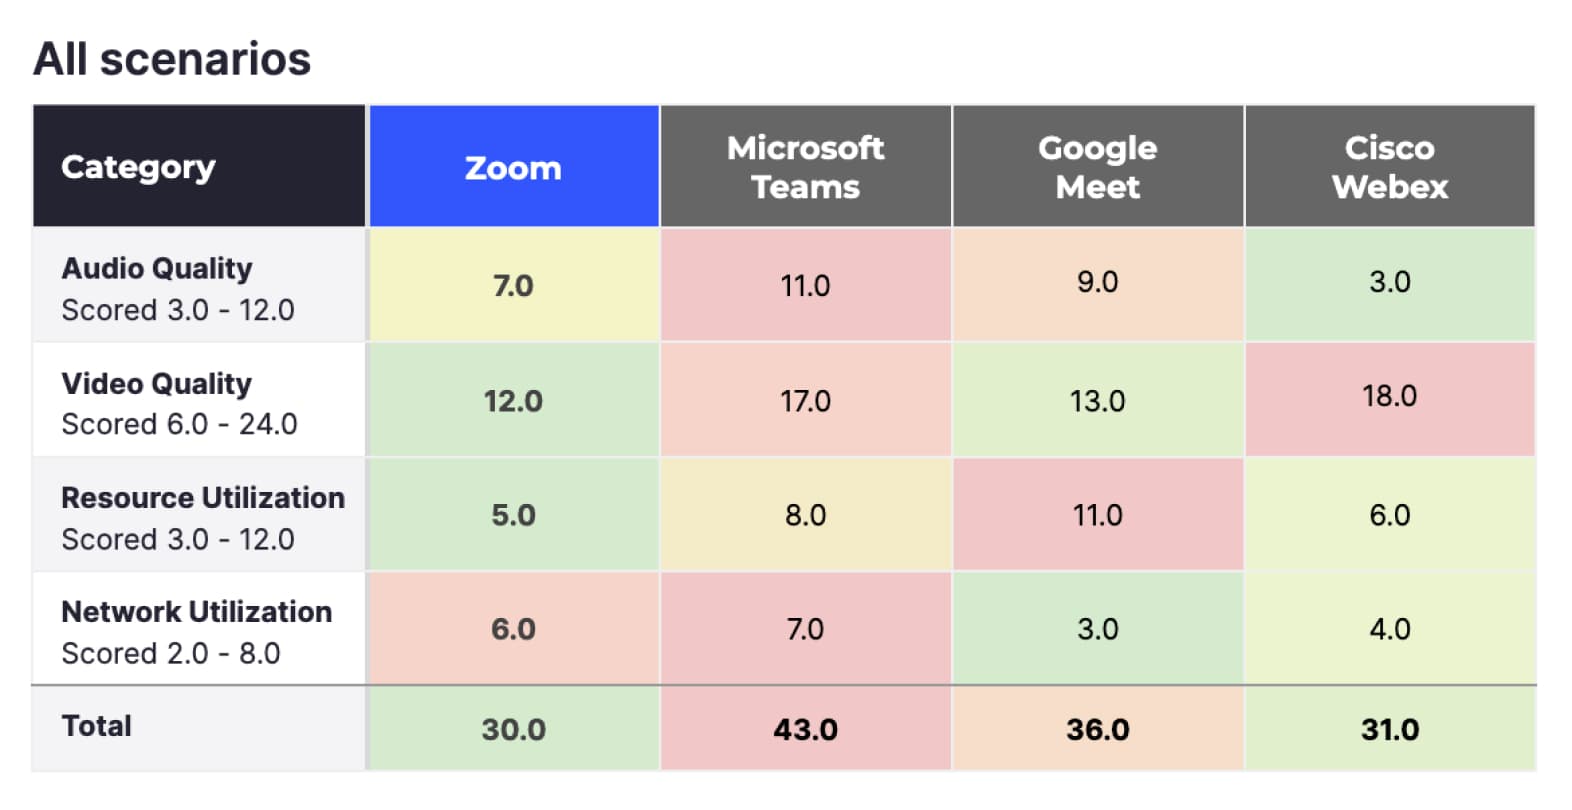
The above results include scores from all 660 meetings, including all devices and network scenarios:
- When considering all metrics, Zoom scored best (30), followed closely by Cisco Webex (31). Google Meet (36) and Microsoft Teams (43) scored worse in comparison.
- Zoom scored best for video quality and resource utilization (12 and 5, respectively). Zoom performed better in this test because Zoom Meetings offloads most video processing functions from the CPU to the GPU, leaving the CPU free to run other apps on the device.
- In network utilization, Google Meet (3) scored best.
- In audio quality, Cisco Webex scored best (3), followed by Zoom (7). Google Meet (9) and Microsoft Teams (11) scored worse in comparison.
Scenarios with clean network only
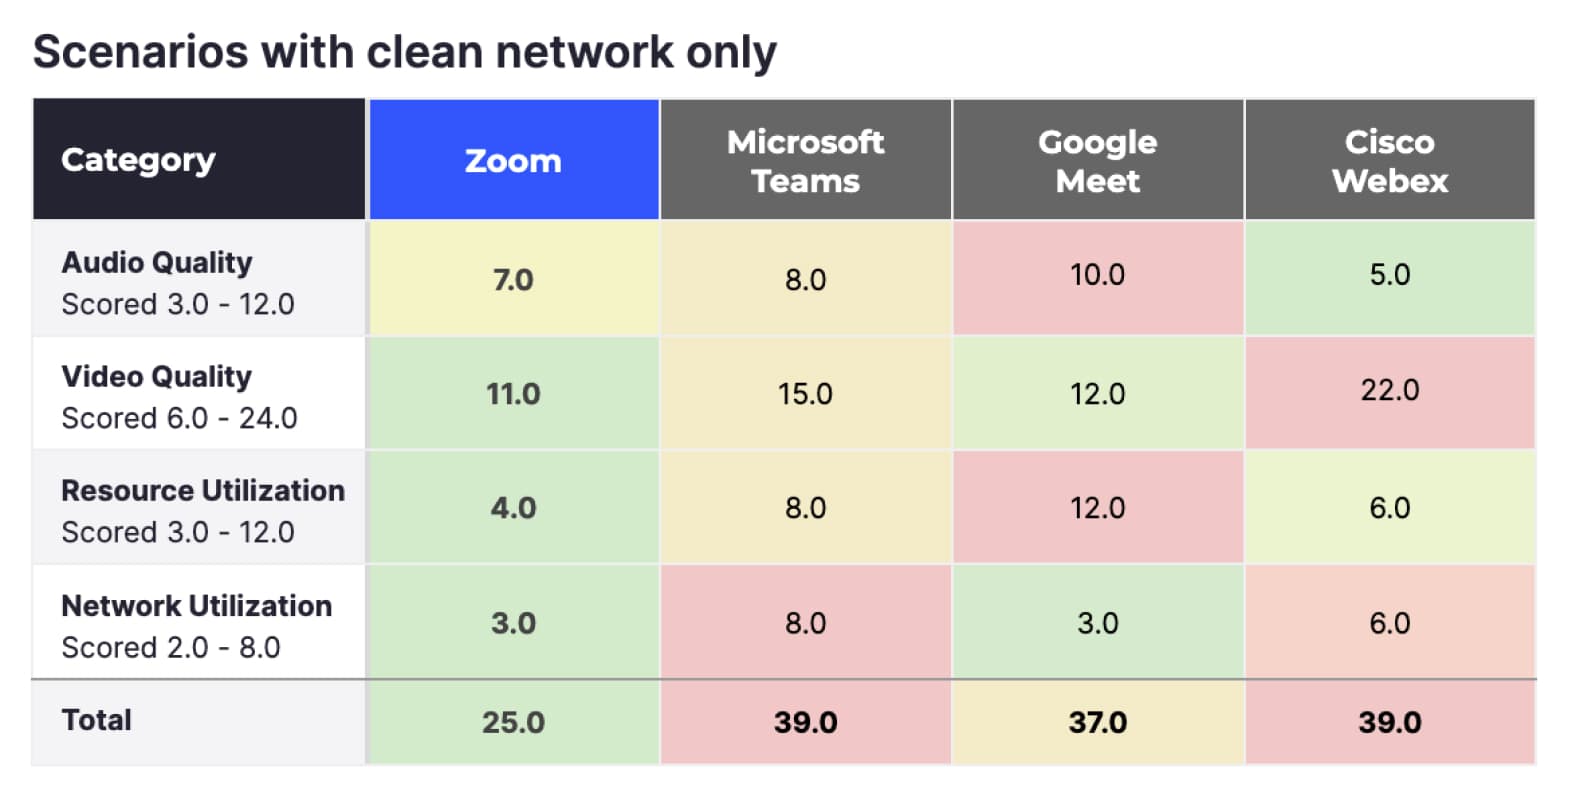
The overall score above represents the entirety of TDL tests, but in reality, most regular users won’t experience many of the network limitations simulated by TDL. The results below filter out all tests that had network limitations, keeping only the clean network tests.
When looking at clean network meetings, Zoom (25) scores even better, Google Meet (37) scores second, and Microsoft Teams (39) and Cisco Webex (39) score last.
Scenarios using desktop devices only
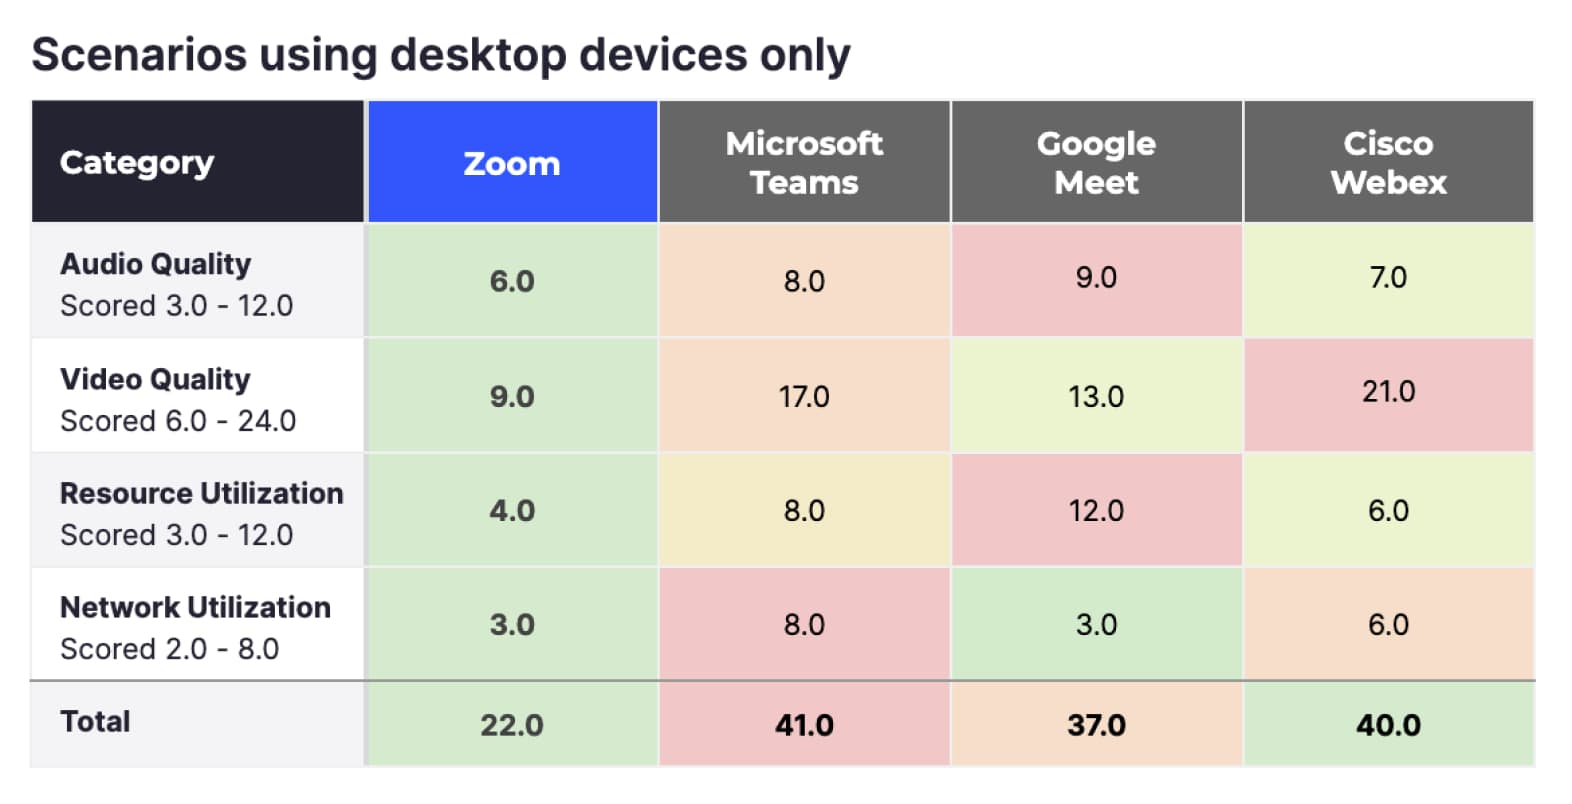
While many people use mobile devices to connect to meetings, an average of ~66% of all Zoom participants connect using desktop devices (according to internal Zoom statistics). When filtering the data to Desktop only and meetings without network issues, Zoom’s lead increases even further, and also leads in all four metrics.
Summary
Zoom outperforms the tested alternative meeting services in every category TDL measured under ideal conditions and the most commonly used devices. As conditions are not always ideal, it’s important to measure circumstances where users may experience network problems.
Vendors can automatically adjust to changing network conditions to maintain high-quality video and audio. Each vendor’s protocol adapts differently, potentially changing video resolution, compression quality, FPS, and other factors. The overall user experience during a video call depends on how well the vendor can keep these parameters optimized as network conditions fluctuate.
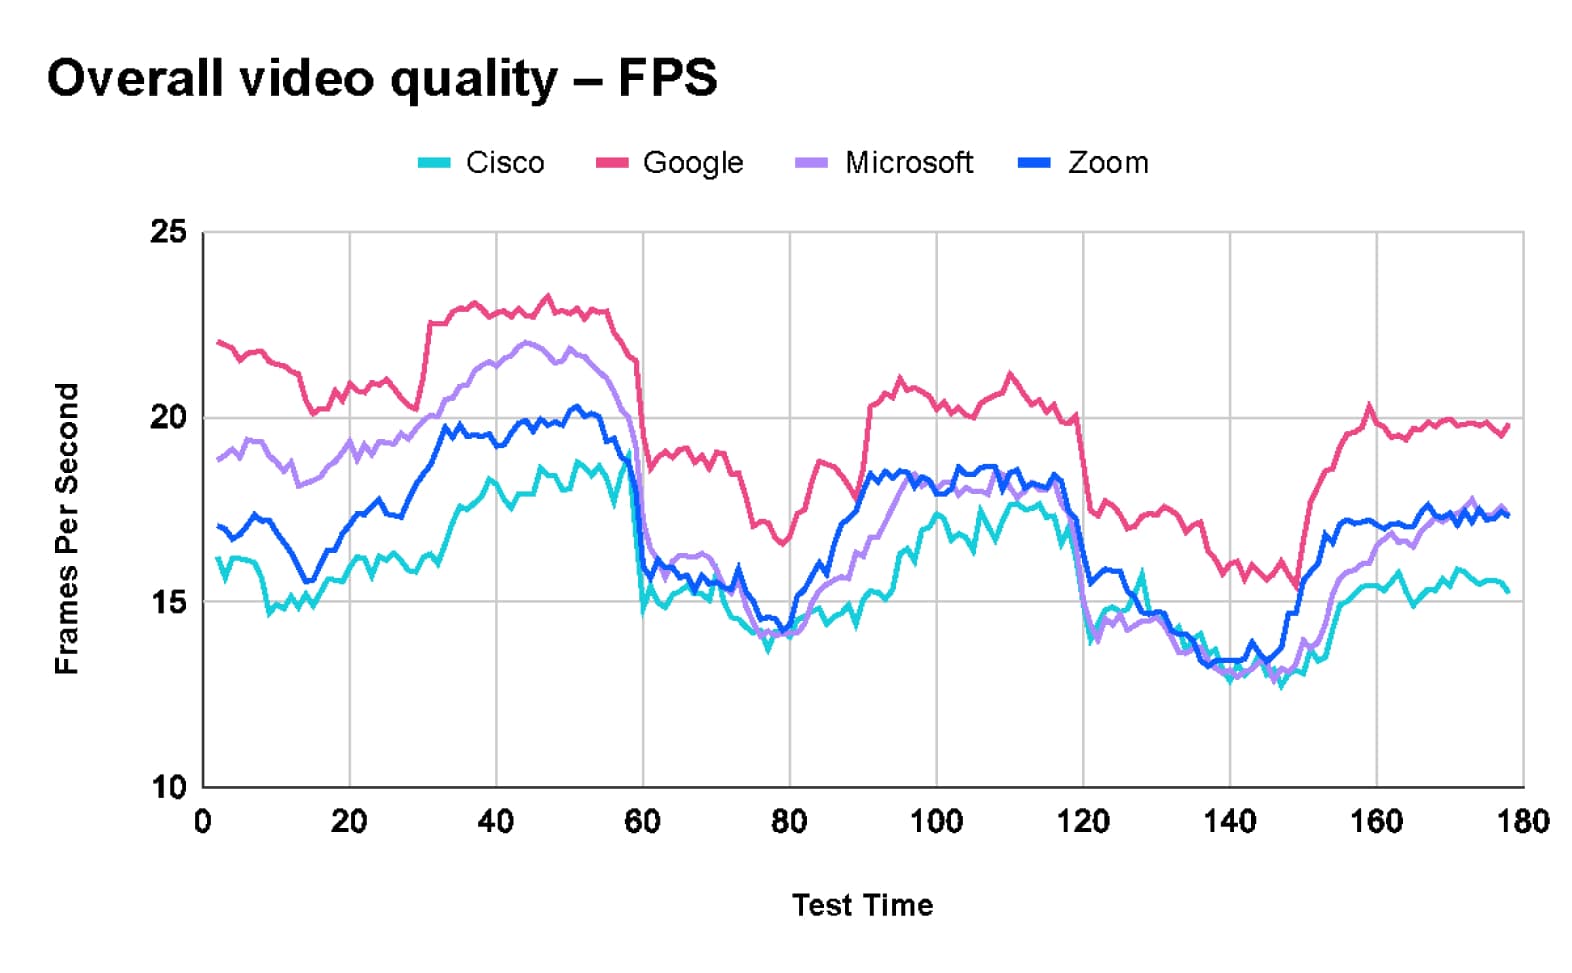
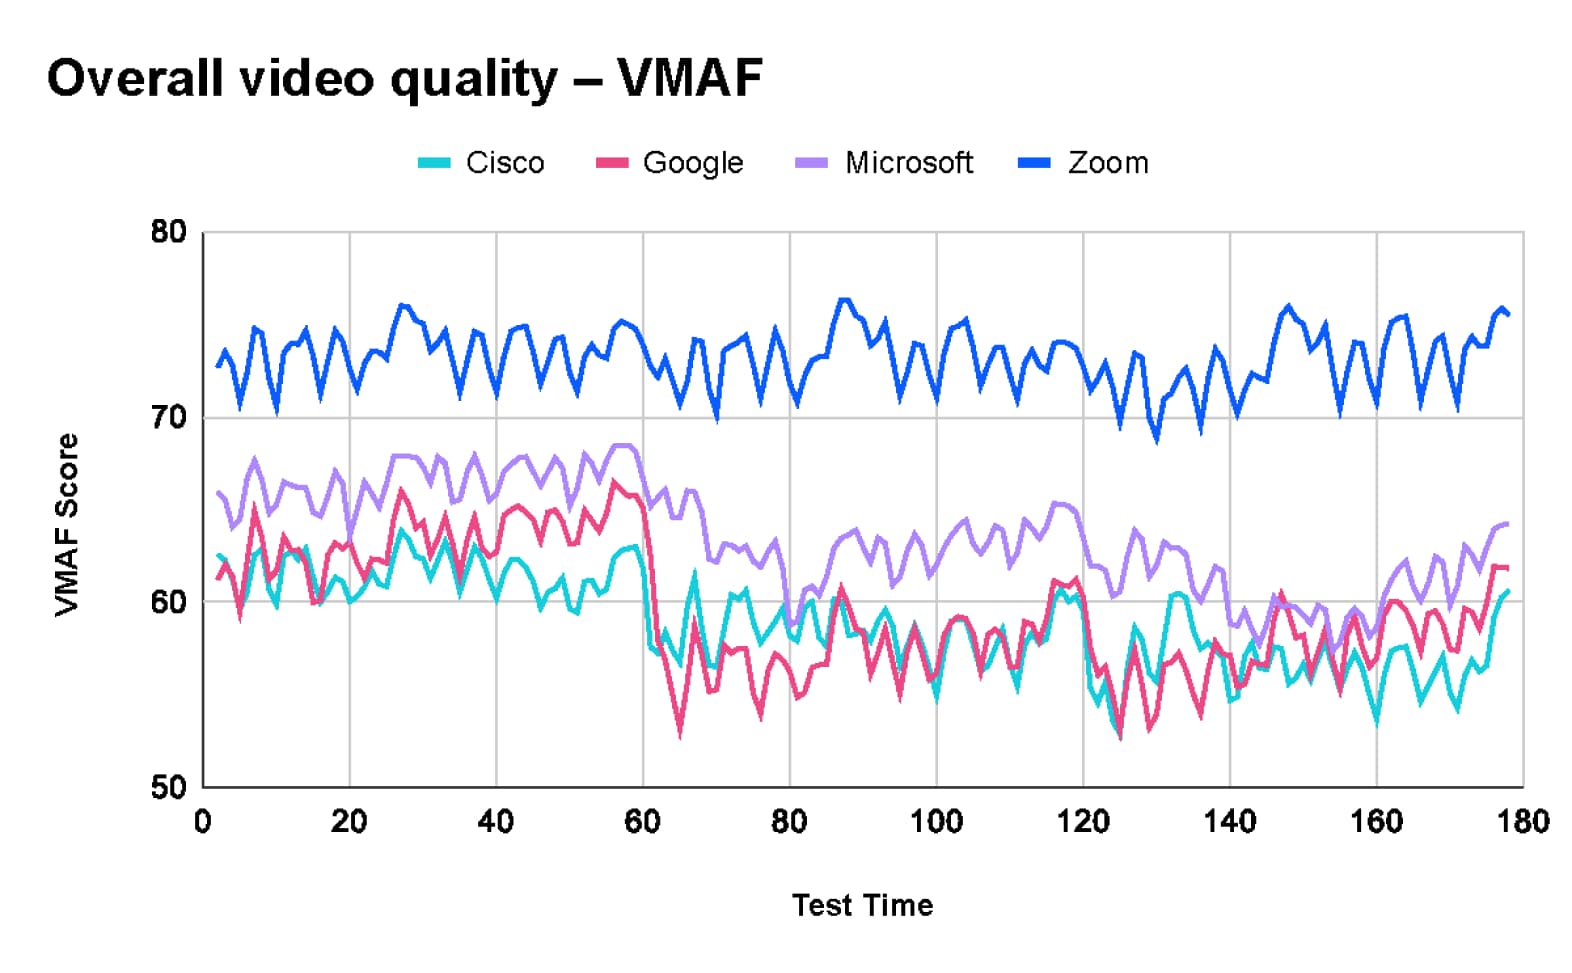
TestDevLab collected multiple metrics to measure the overall user experience in a call. The two most impactful metrics collected are VMAF, which measures the perceived image quality, and Frames Per Second (FPS), which shows the fluidity of the video.
Overall video quality across all tests
After analyzing the combined test results of 660 tests, TDL found that Google Meet provides the highest average frame rate at 20 frames per second (fps). In comparison, Microsoft Teams and Zoom both average 17 fps, while Webex averages 16 fps.
However, Google Meet's higher frame rate comes with a trade-off in video quality. According to the Video Multimethod Assessment Fusion (VMAF) chart, Zoom leads in quality with an average score of 73.2. Microsoft Teams follows with a score of 63.5, Google Meet scores 59.5, and Webex has an average score of 58.9.
Video quality with packet loss
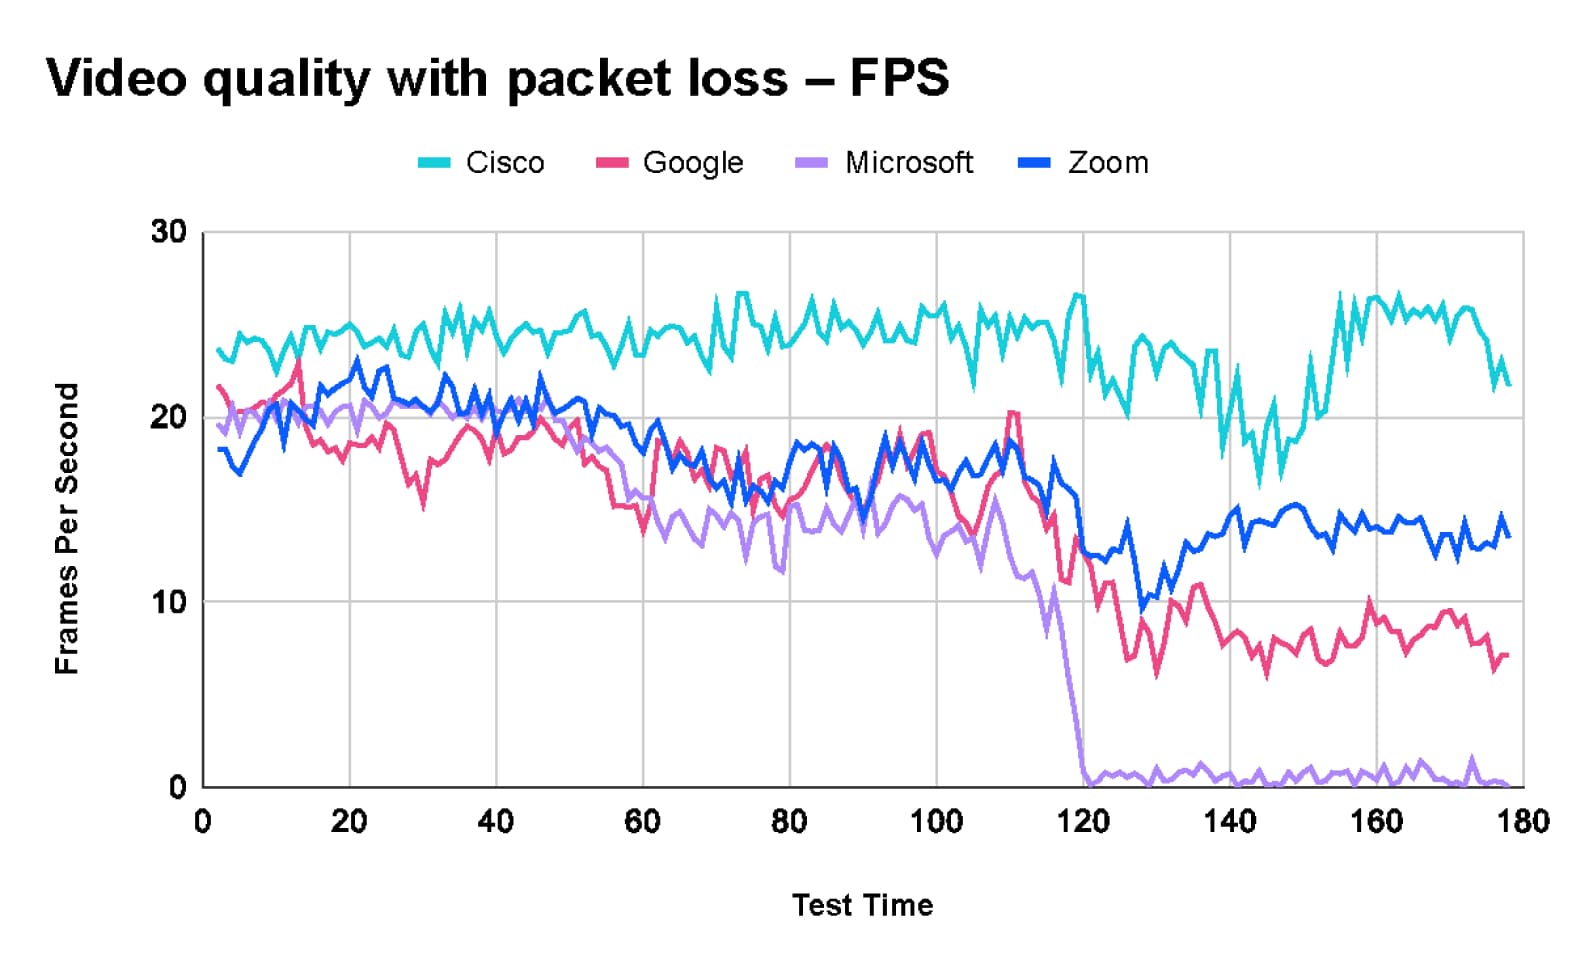
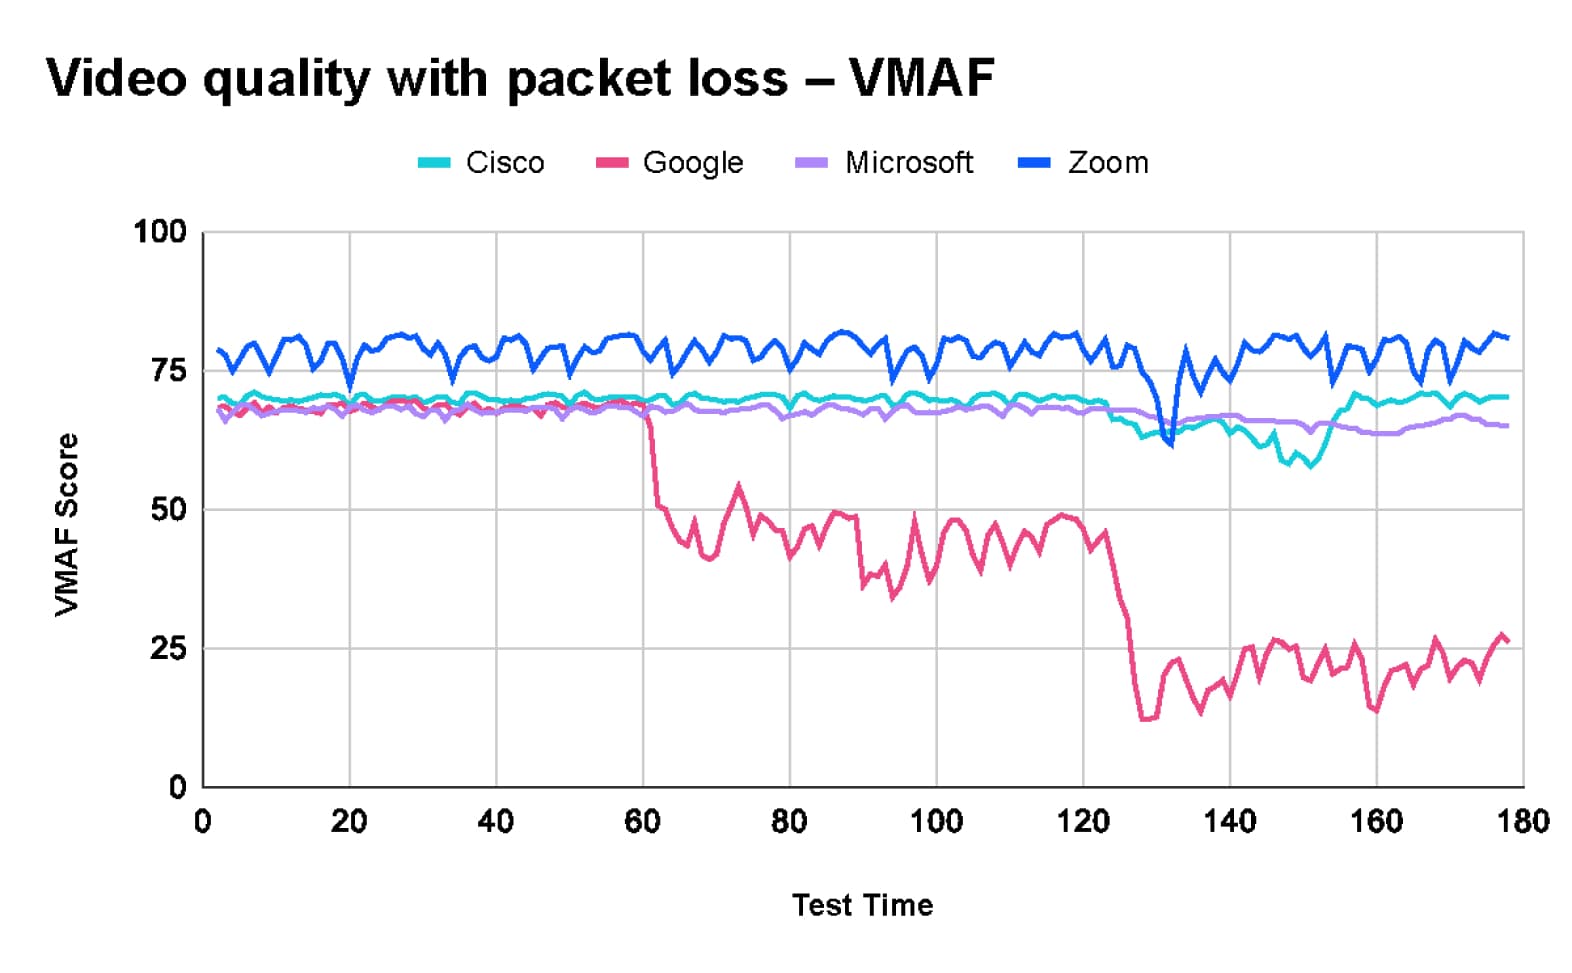
The packet loss test conducted by TestDevLab included three stages.
- The call started with a 10% packet loss.
- After 60 seconds, packet loss was increased to 20%.
- After another 60 seconds, the packet loss was further increased to 40%.
As shown in the charts below:
- Zoom maintains top video quality with a VMAF score of around 80, but the frame rate drops from approximately 20 fps to 13 fps.
- Webex maintains relatively stable video quality and frame rate throughout the test.
- Google Meet experiences a significant drop in VMAF score from 70 to 20 with 40% packet loss, and the frame rate decreases from around 15 fps to 8 fps by the end of the test.
- Microsoft Teams maintains image quality with a VMAF score of 70. However, the frame rate drops dramatically from around 20 fps at the start of the test to 2 fps when 40% packet loss is introduced, resulting in a frozen video experience.
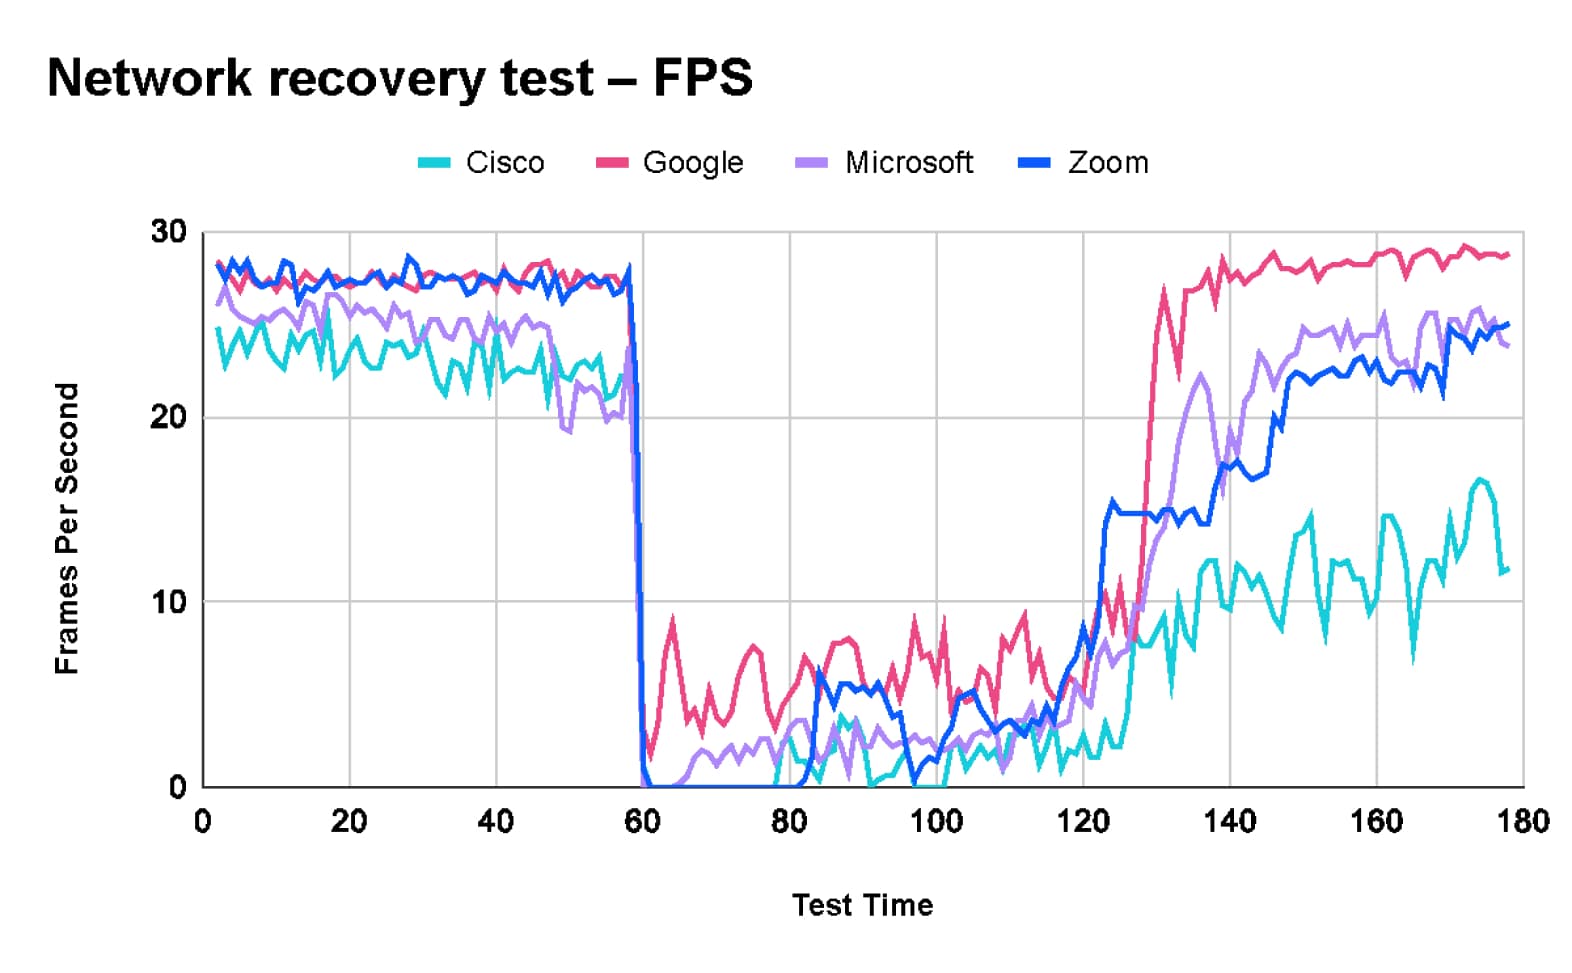
Network recovery test
In the network recovery test, TDL started the test with a clean network.
- At the 60-second mark, a host of network issues were introduced, including a 1Mbps limit, 10% Packet Loss, 100 ms delay, and 30 ms jitter.
- After 60 seconds of “bad network,” the limitations were lifted, and the network returned to its original state.
This test was designed to test the behavior of the tested platforms when a temporary issue occurs on the network and the ability of each platform to recover when the issue no longer exists.
The test results show that while Zoom maintains high-quality video, it takes ~10 seconds to readjust its codec parameters to the new network conditions, resulting in a very low frame rate for a number of seconds. Regarding recovery time, Zoom is in the middle of the pack, between Webex with very low recovery time to Teams and Google with fast recovery.
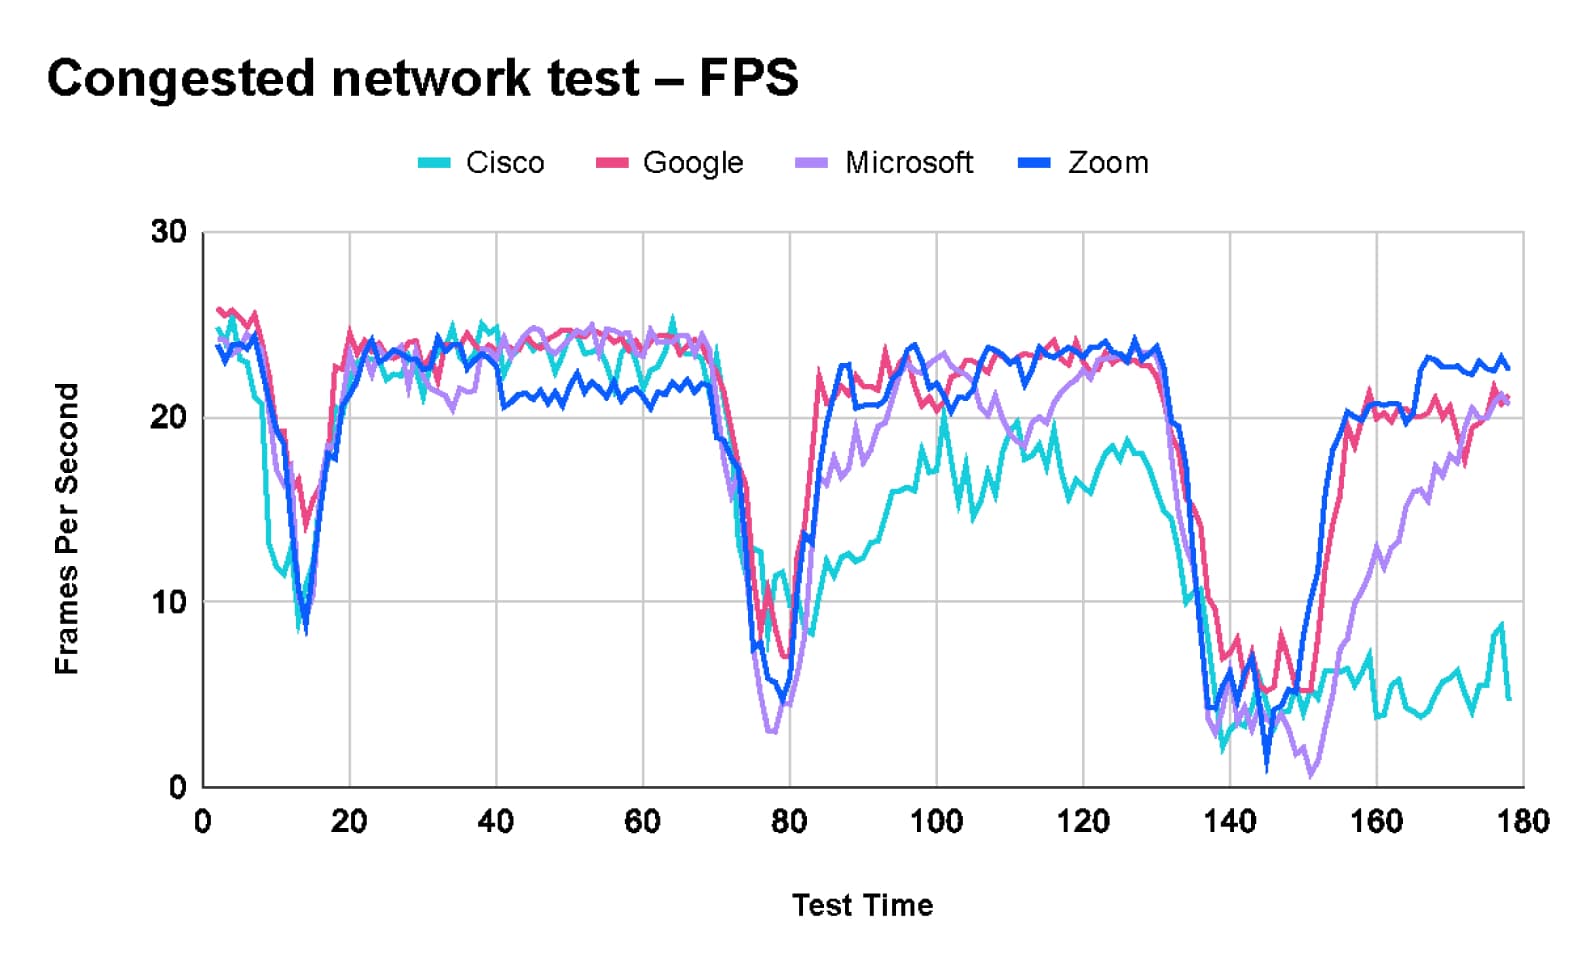
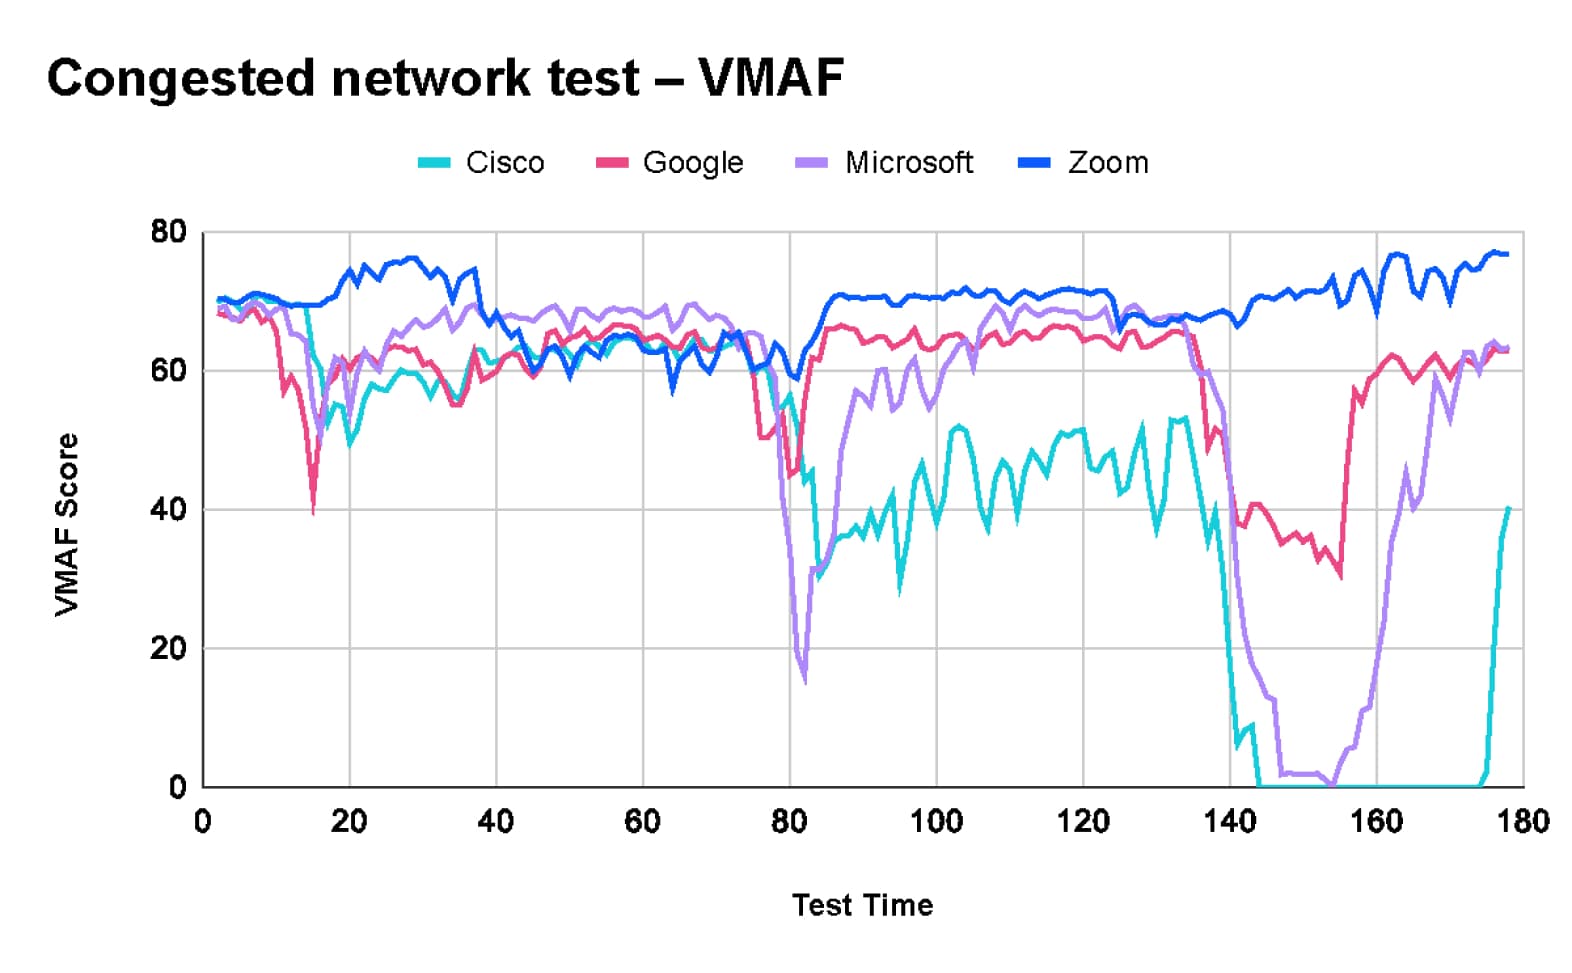
Congested network test
The goal of the Congested Network Test was to evaluate the behavior of the tested platforms under varying durations of network congestion and their ability to maintain performance on networks with intermittent traffic bloats.
- The test script alternated between periods of inactivity and 10Mbps traffic bloat (on a 10Mbps line), with increasing durations of congestion and varying lengths of pauses in between.
The test results show that Zoom maintains image quality throughout the test while sacrificing frame rate and video delay to accommodate the changing network conditions. Notably, Webex completely dropped the video by the end of the test.
Virtual background quality test
In our testing scenarios, we tasked TDL with evaluating the user experience of the virtual background feature. This feature replaces the user's real background with an image or video, requiring significant processing to generate a high-quality composite image.
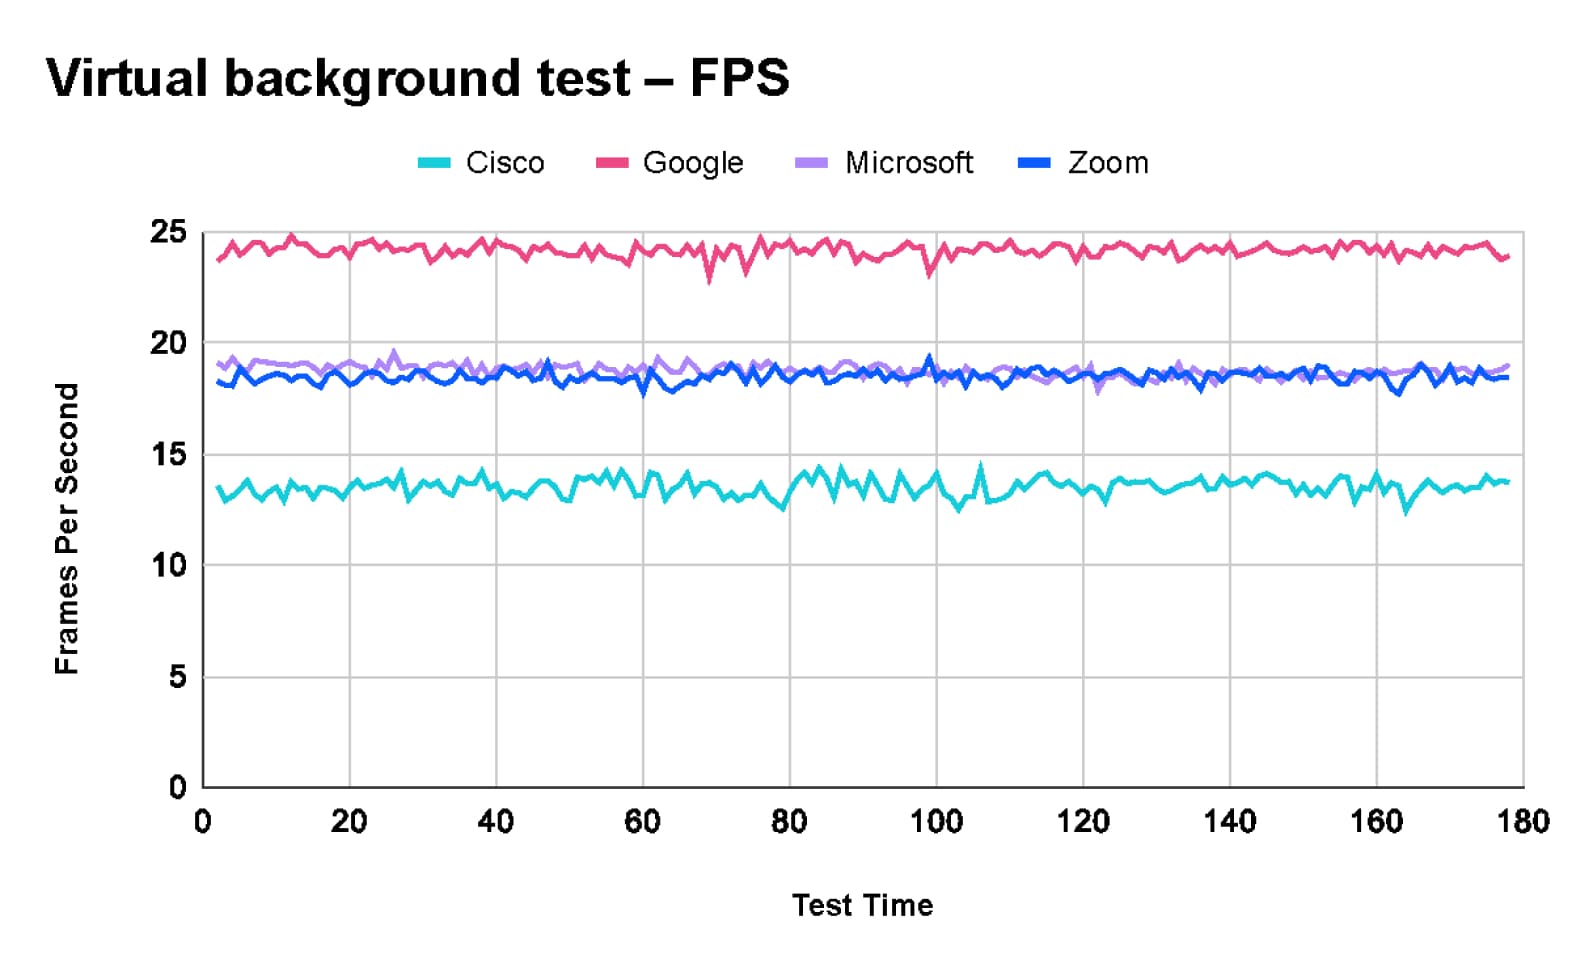
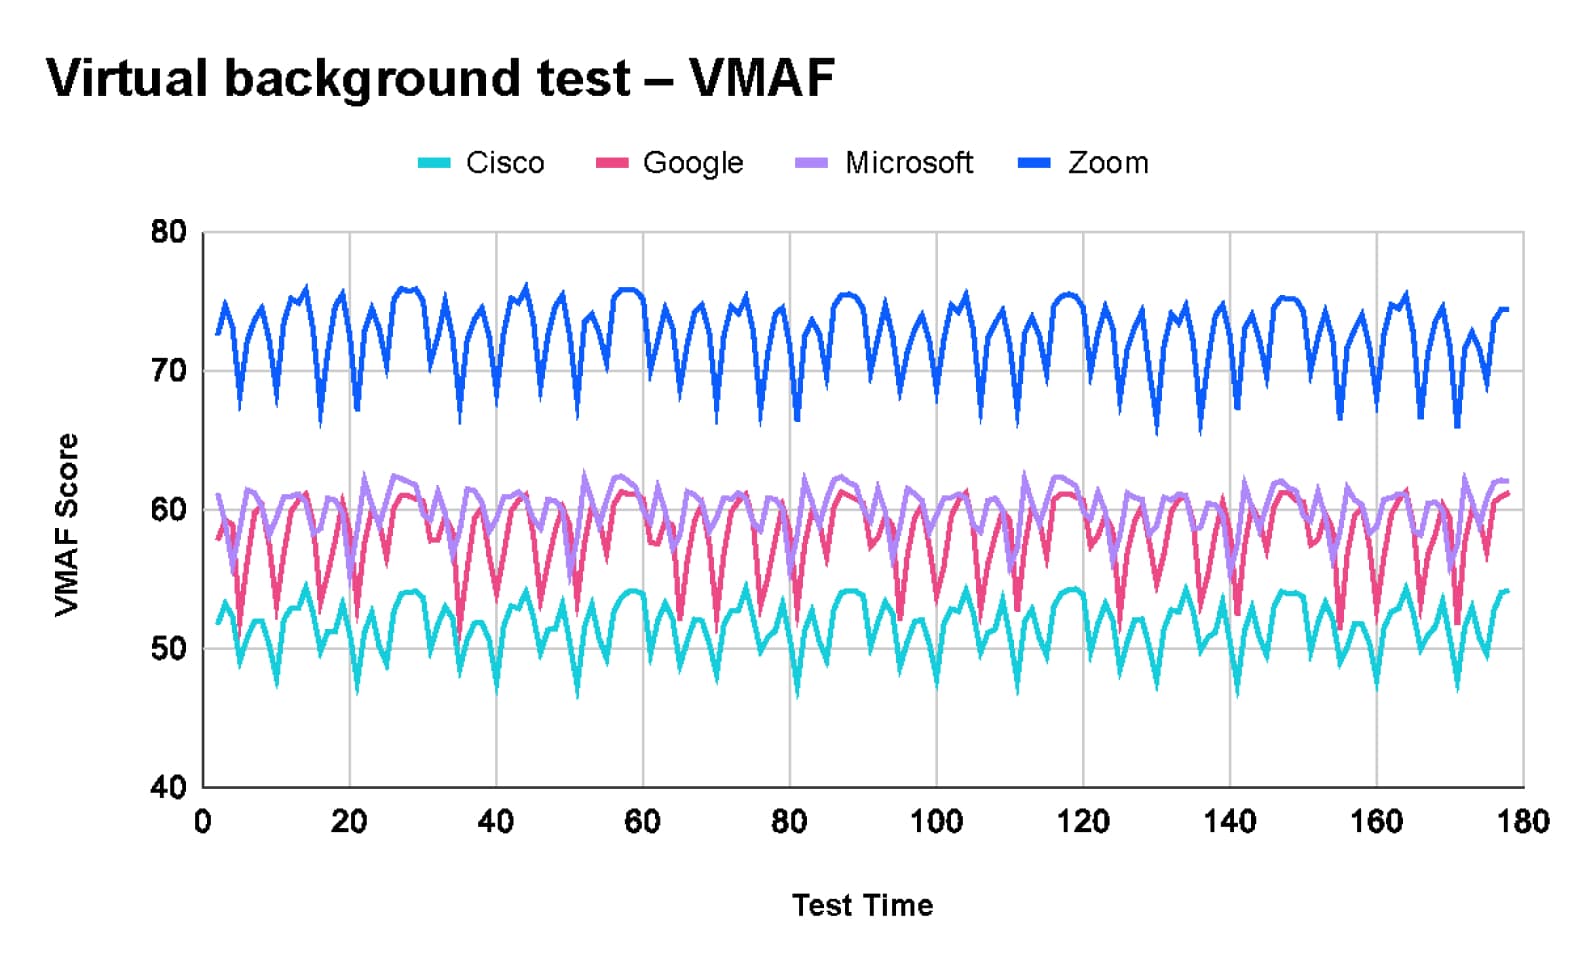
According to TDL's results, Zoom delivered the best image quality. Some meeting clients prioritize video quality, and some prioritize frame rate When scoring by VMAF:
- Zoom (73) with a steady frame rate of 18 fps
- Microsoft Teams (60) with a steady frame rate of 18 fps
- Google Meet (58) with a high frame rate of 24 fps
- Cisco Webex (52) with a low frame rate of 13 fps
These findings are consistent with Zoom internal virtual background quality tests conducted last year, which are shown in this video.
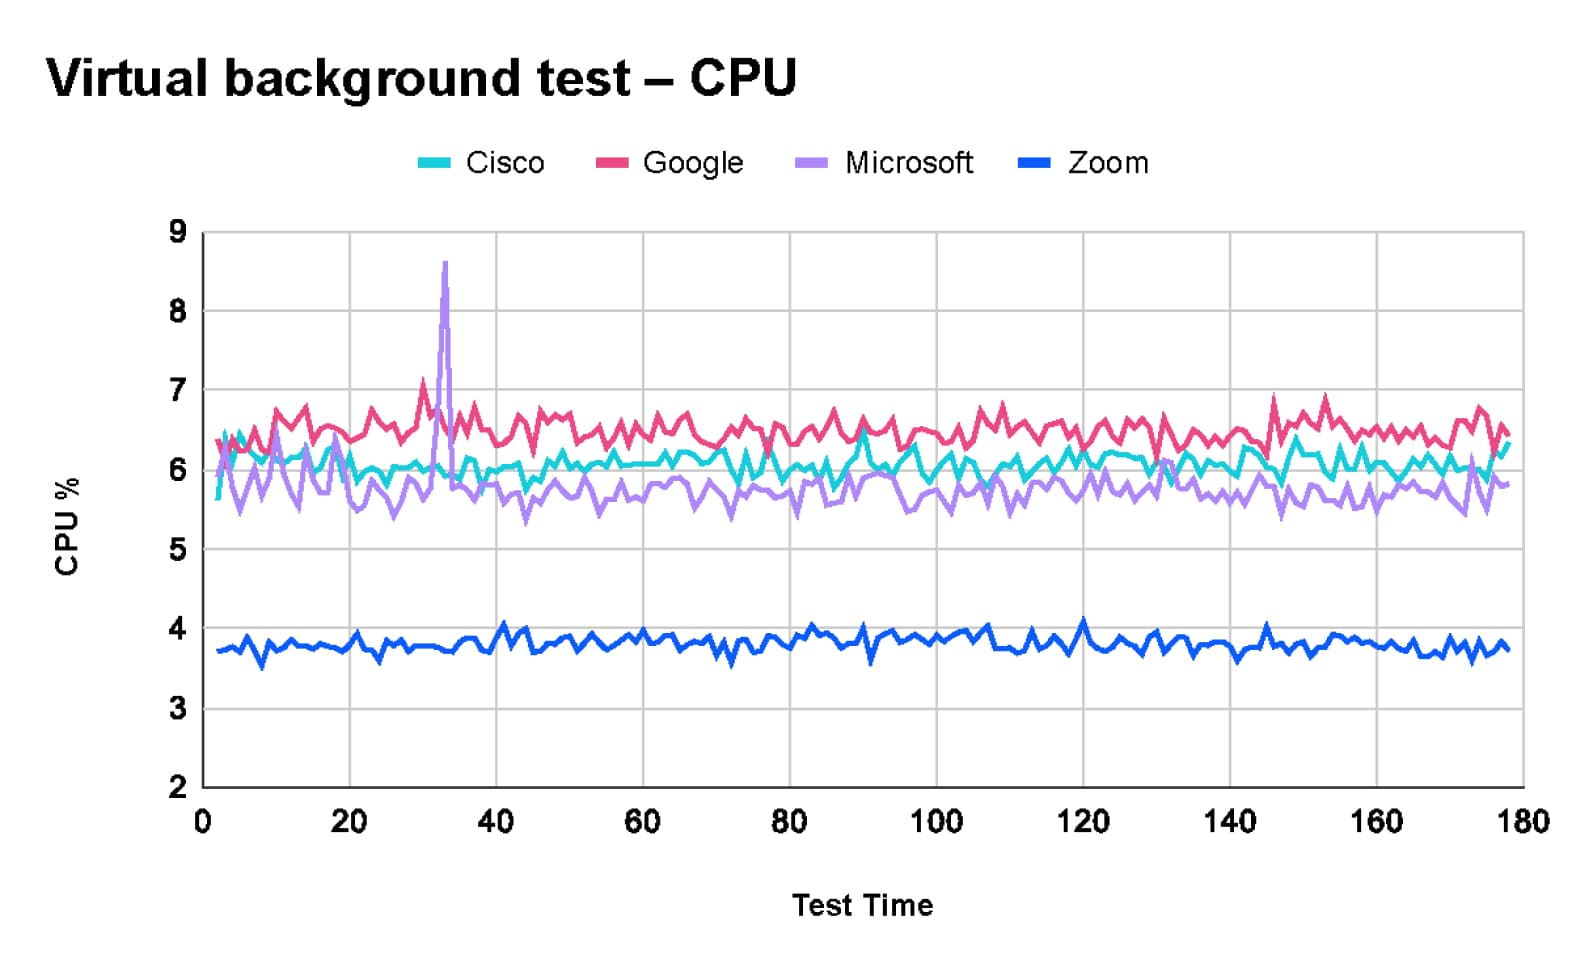
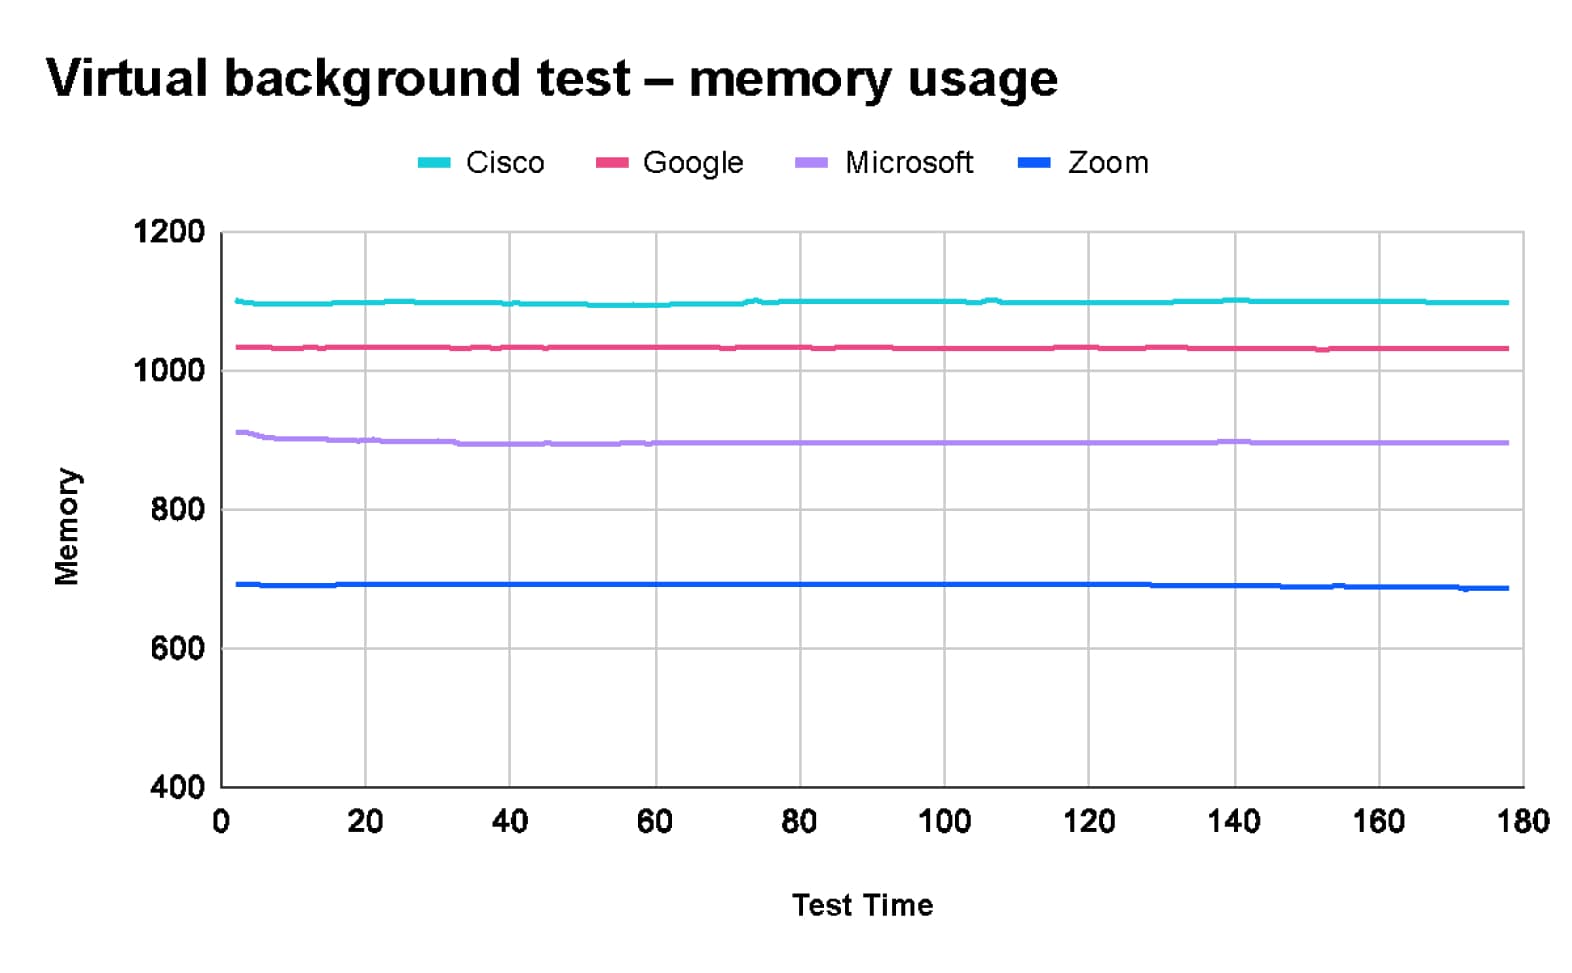
Additionally, TDL's tests revealed that Zoom uses the least CPU and memory resources when utilizing the virtual background feature.
TDL's extensive testing highlights significant differences in performance among Zoom, Microsoft Teams, Google Meet, and Cisco Webex under various network conditions and meeting scenarios.
- Zoom consistently delivers the best overall experience, excelling in video quality, resource utilization, and maintaining performance under network strain.
- Google Meet stands out for its network efficiency, while Cisco Webex offers good audio quality.
- Zoom's leading performance, particularly in high-quality video and efficient resource use, positions it as the top choice for robust and reliable virtual meetings.
