
Meet Zoom AI Companion, your new AI assistant!
Boost productivity and team collaboration with Zoom AI Companion, available at no additional cost with eligible paid Zoom plans.
A call center dashboard is a centralized interface that displays real-time and historical call center performance metrics, such as call volume, wait times, agent availability, and service levels.
Updated on March 03, 2026
Published on March 03, 2026


Feeling buried in call data? A clear call center dashboard makes performance instantly visible. With real-time insights into key metrics, teams can act quickly and keep operations on track. This allows managers and agents to make data-driven decisions that optimize operations, enhance customer experience, and drive business success.
This article explores the types, features, and best practices of call center analytics dashboards, empowering you to transform raw data into actionable intelligence for exceptional customer service.
A call center dashboard is a visual tool that shows key metrics and performance indicators in real time. It makes it easy to track things like call volume, average handle time, average wait time, flagged interactions, agent availability, and service levels, all in one clear, easy-to-read view with charts, graphs, and gauges.
The primary purpose of a call center KPI dashboard is to provide managers and agents with the insights they need to monitor performance, identify trends, and make informed decisions to improve efficiency and enhance the customer experience.
Call center dashboards are designed for specific roles and needs. They highlight the metrics that matter most, giving teams and managers a clear view of performance at a glance.
The table below highlights different types of call center dashboards, their purpose, and the key call center KPIs they track to help teams monitor performance and improve customer experience.
|
Type |
Purpose |
Call center KPIs |
|
Operational dashboards |
Provides a real-time view of key call center metrics for immediate action |
|
|
Agent performance dashboards |
Tracks individual agent metrics to optimize performance and coaching |
|
|
Strategic dashboards |
Provides a long-term, high-level view of key metrics to guide business decisions |
|
|
Customer experience dashboards |
Tracks customer satisfaction and sentiment to improve the customer journey |
|
|
Multichannel dashboards |
Provides a unified view of customer interactions across all communication channels |
|
|
Real-time dashboards |
Provides a live, up-to-the-second view of current call center activity |
|
|
Historical dashboards |
Analyzes past data to identify trends and inform future strategies |
|
|
Predictive dashboards |
Forecasts future trends to optimize call center operations |
|
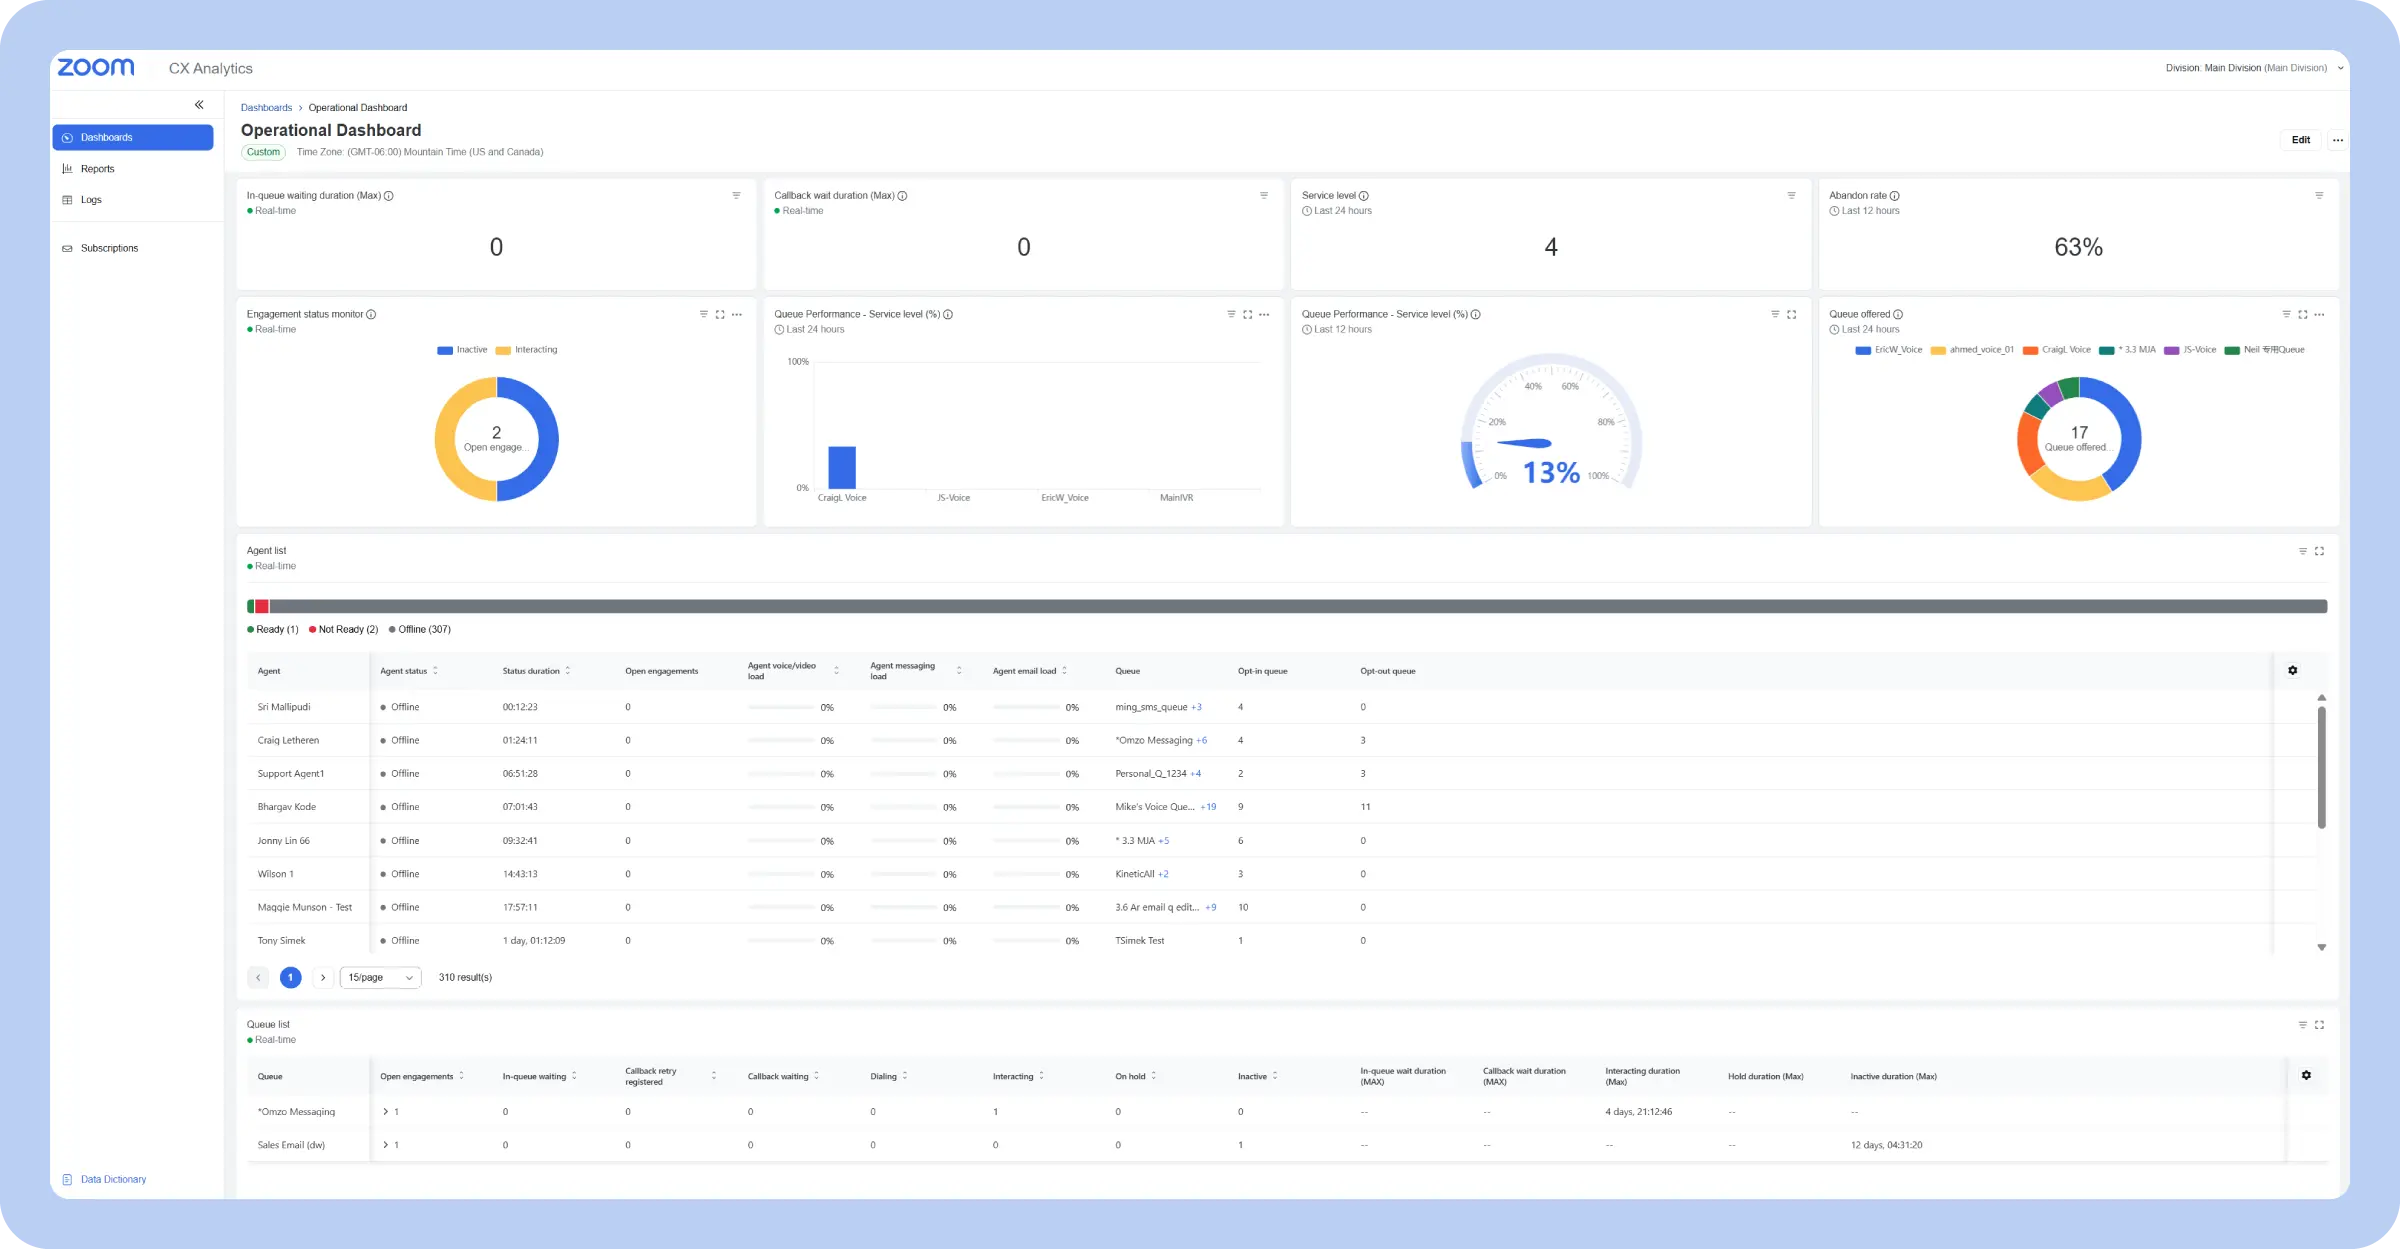
Purpose: Provides a real-time view of key call center metrics for immediate action
Key metrics:
An operational call center dashboard provides a real-time snapshot of a call center’s current performance, acting as the pulse monitor for daily activities. It focuses on immediate, actionable data, displaying key metrics like call volume, average handle time, service level, call abandonment rate, and queue length.
These metrics offer a clear picture of what’s happening in the call center at any given moment, allowing supervisors to quickly identify bottlenecks, spikes in call volume, and deviations from target service levels.
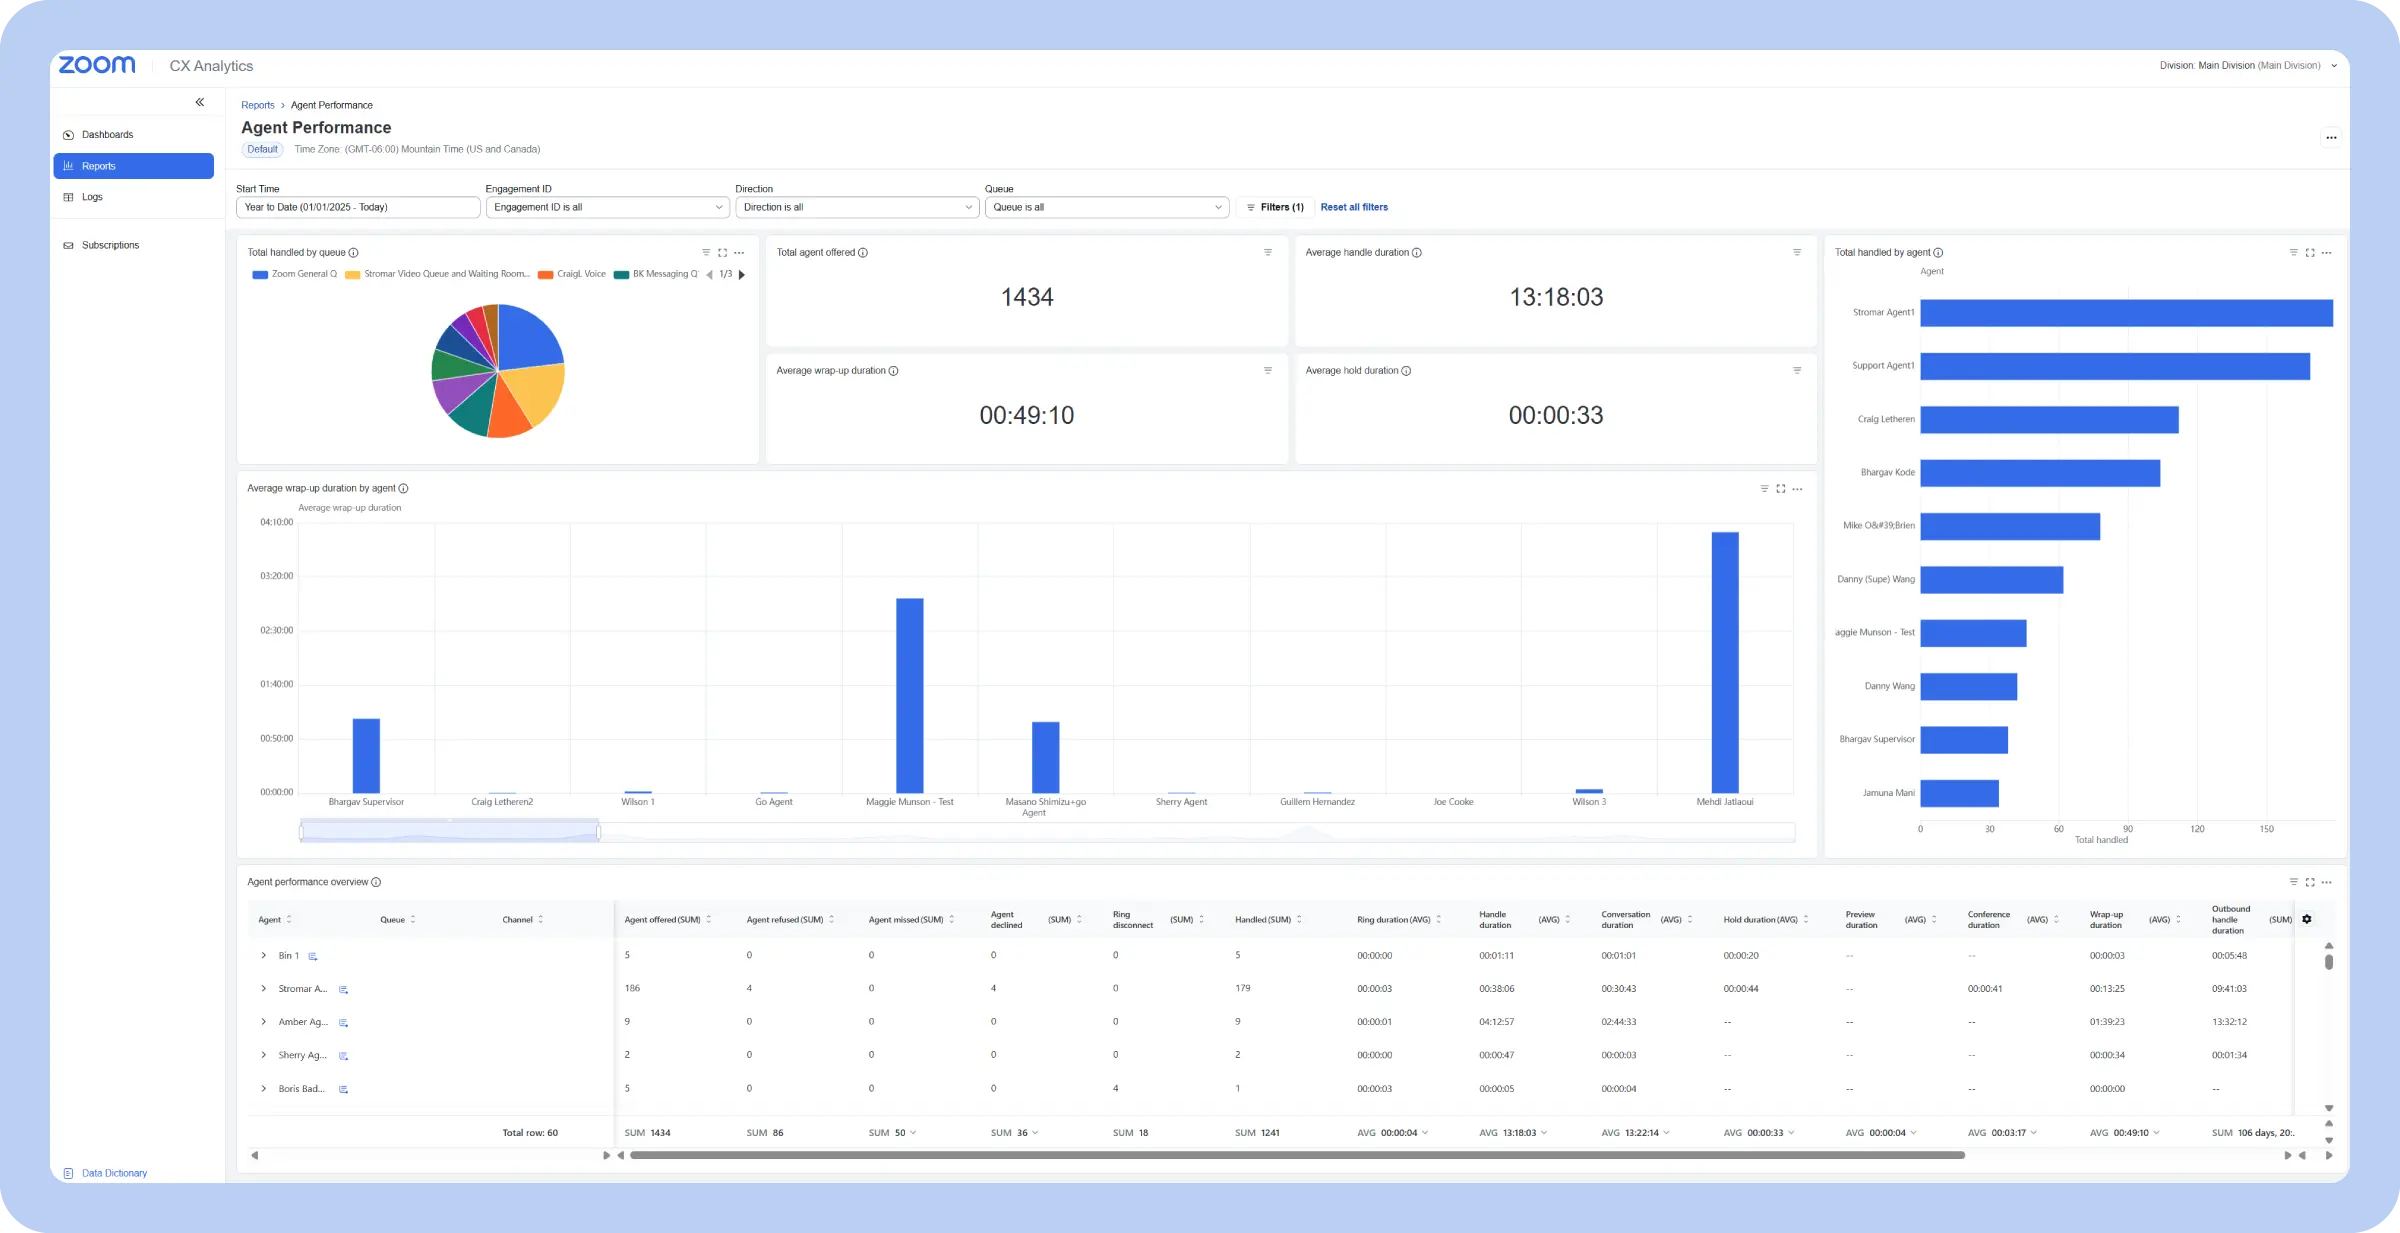
Purpose: Tracks individual agent metrics to optimize performance and coaching
Key metrics:
An agent performance dashboard focuses on individual agents, providing a detailed view of their productivity and performance. Unlike operational dashboards that focus on overall team metrics, this type dives deep into individual contributions, tracking metrics such as calls handled, average handle time, and CSAT scores.
This granular data allows supervisors to identify top performers, pinpoint areas where agents might be struggling, and tailor coaching and training accordingly.
Purpose: Provides a long-term, high-level view of key metrics to guide business decisions
Key metrics:
A strategic call center dashboard provides a high-level, long-term view of call center performance, focusing on trends and overall effectiveness rather than real-time fluctuations. It pulls back from the day-to-day and shows KPIs that connect the call center’s work to bigger business outcomes.
The data is often presented in visualizations that show performance over weeks, months, or even years, so managers can identify long-term trends, assess the impact of strategic initiatives, and make informed decisions about resource allocation, technology investments, and future goals.
Purpose: Tracks customer satisfaction and sentiment to improve the customer journey
Key metrics:
A customer experience contact center dashboard focuses specifically on the customer’s perspective, providing insights into their interactions and satisfaction levels. It moves beyond traditional operational metrics and delves into how customers feel about their experience with the call center.
Customer experience dashboards are essential for understanding the customer journey and identifying pain points. They help call center managers understand what’s working well and where improvements are needed to create a positive customer experience. For example, a sudden dip in CSAT scores might prompt an investigation into recent changes in call handling procedures or product updates. Keeping an open eye on customer voice and feedback is essential to the experience.
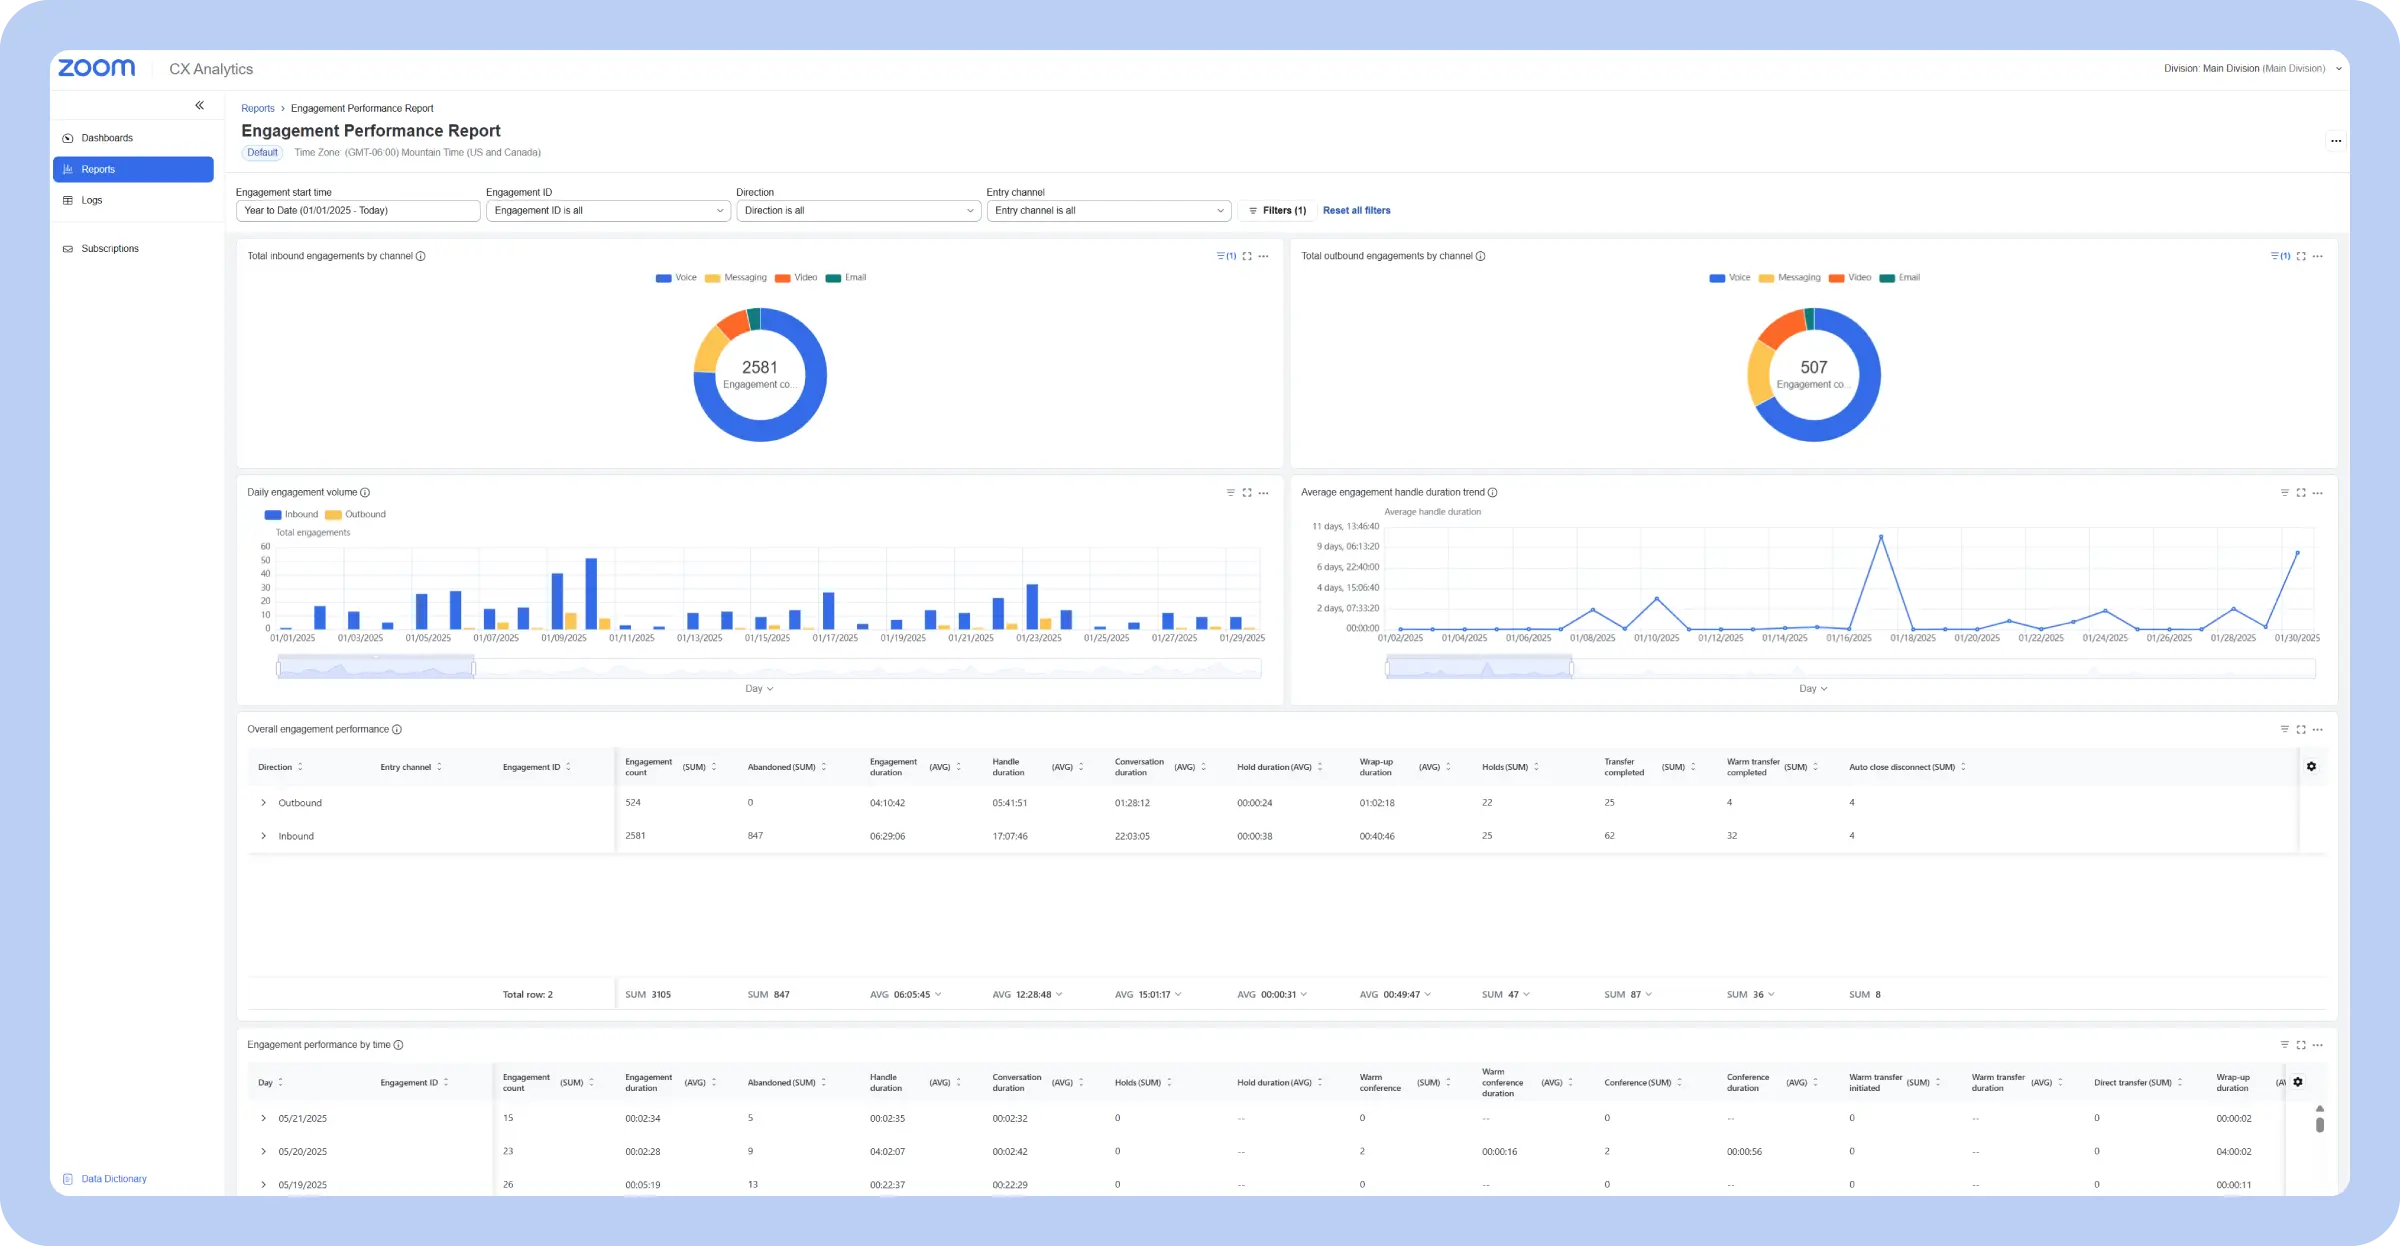
Purpose: Provides a unified view of customer interactions across all communication channels
Key metrics:
A multichannel call center reporting dashboard provides a unified view of customer interactions across all communication channels, moving beyond just phone calls to encompass email, chat, social media, SMS, and other digital touchpoints. It pulls data from each channel to provide a holistic understanding of customer engagement and preferences.
Multichannel dashboards are essential for managing a modern omnichannel contact center. They allow managers to see how customers are choosing to interact with the business and identify any bottlenecks or inconsistencies in service across different channels. For example, if the dashboard reveals a high volume of unanswered emails, it might indicate a need for additional email support staff.
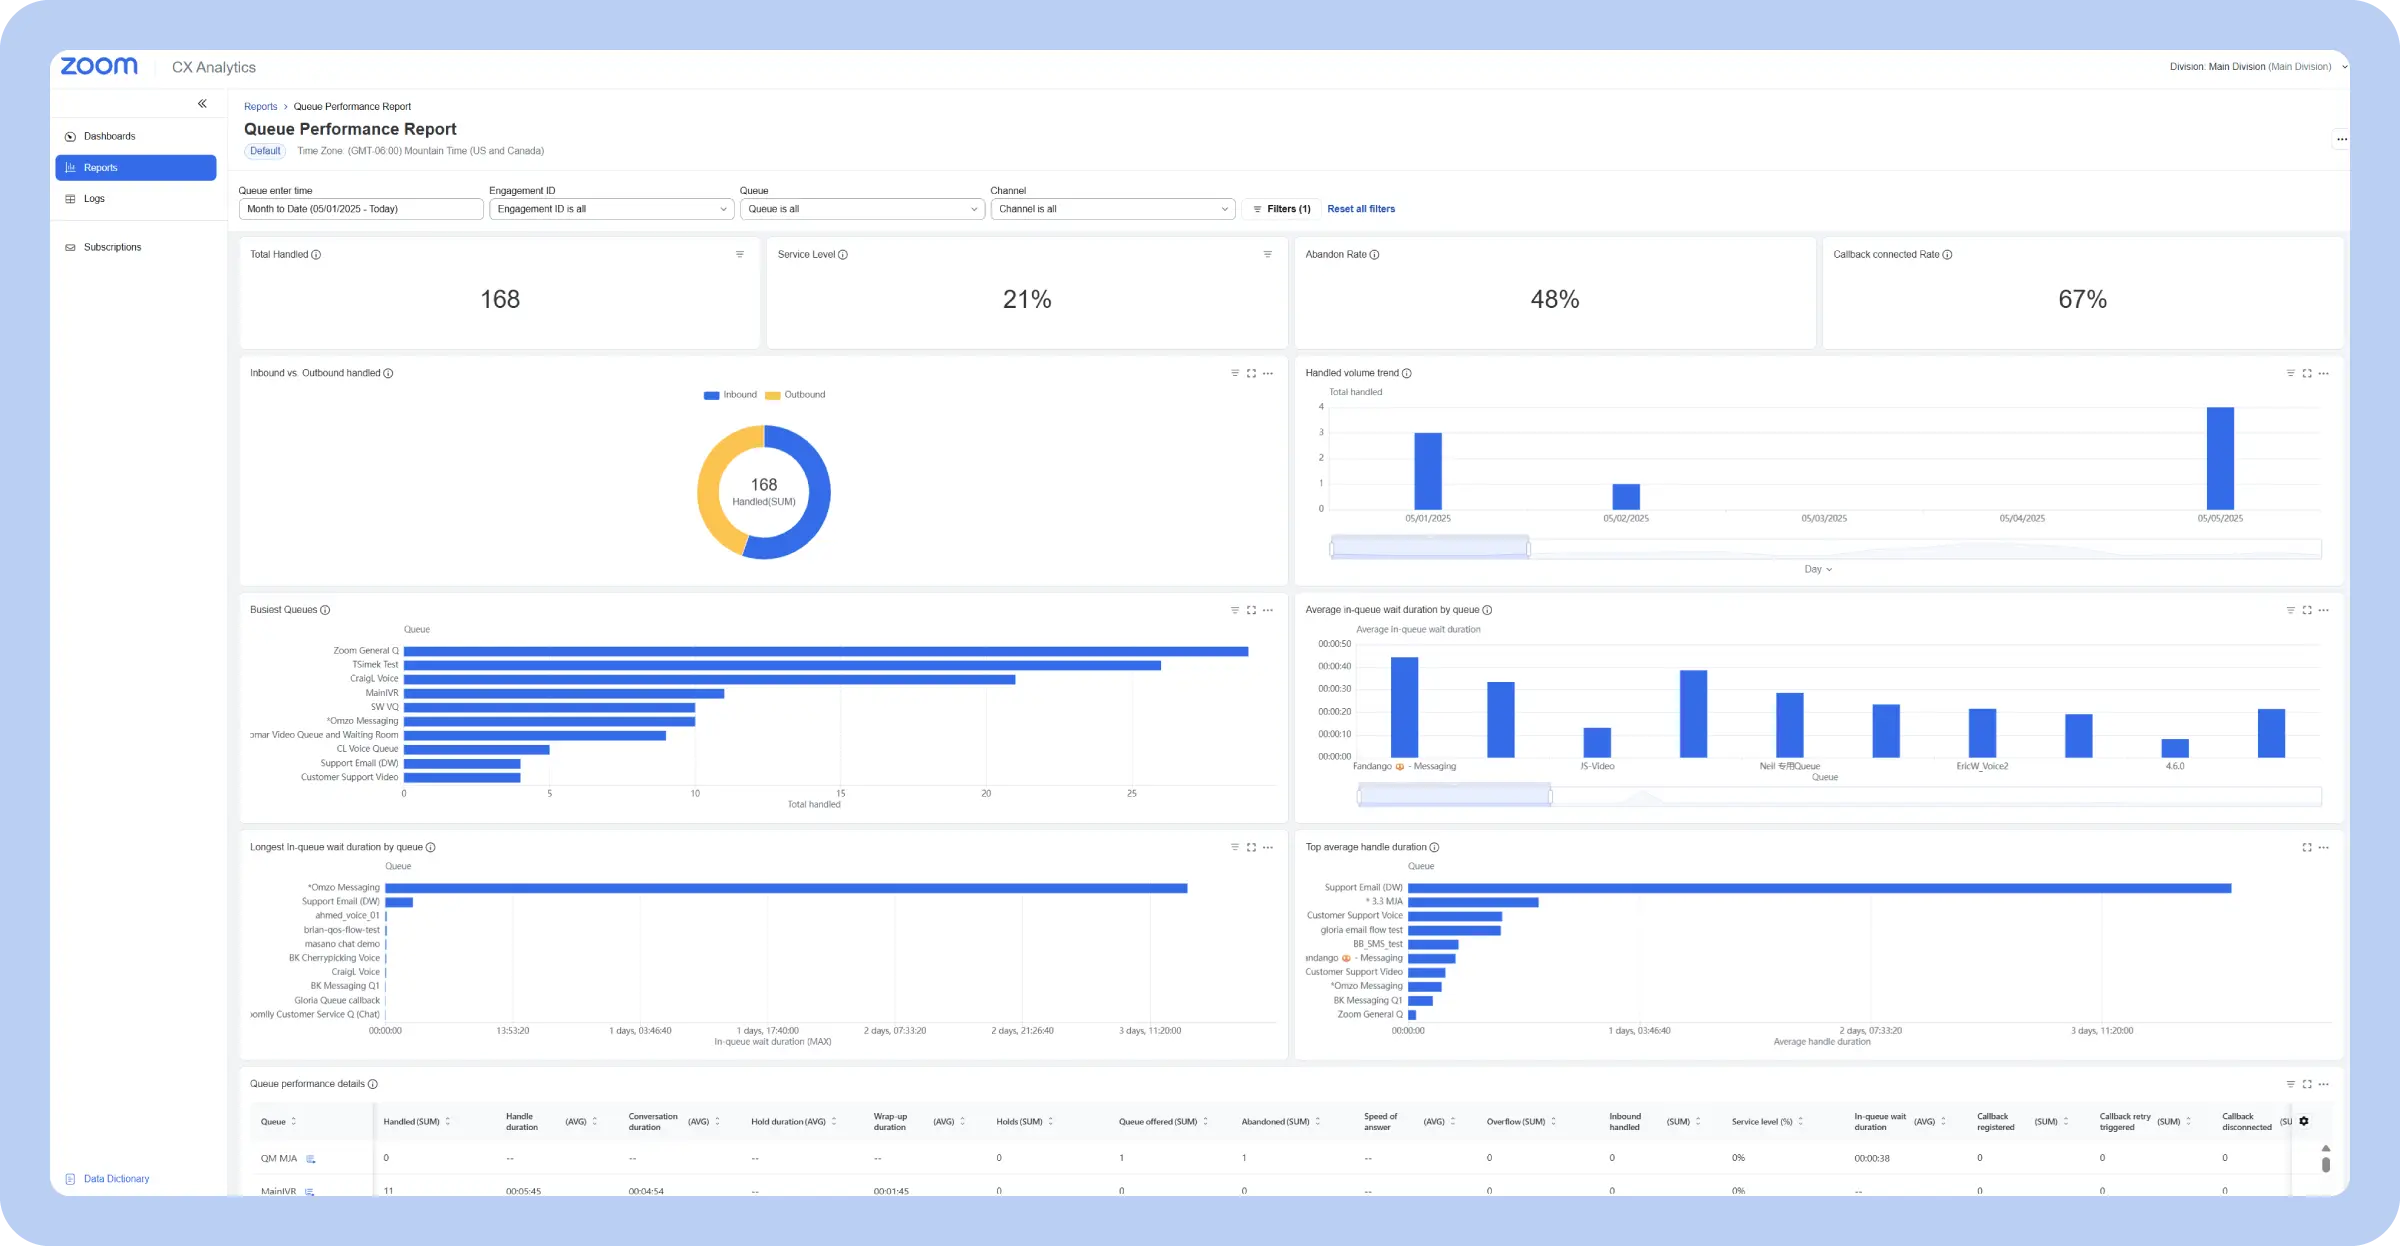
Purpose: Provides a live, up-to-the-second view of current call center activity
Key metrics:
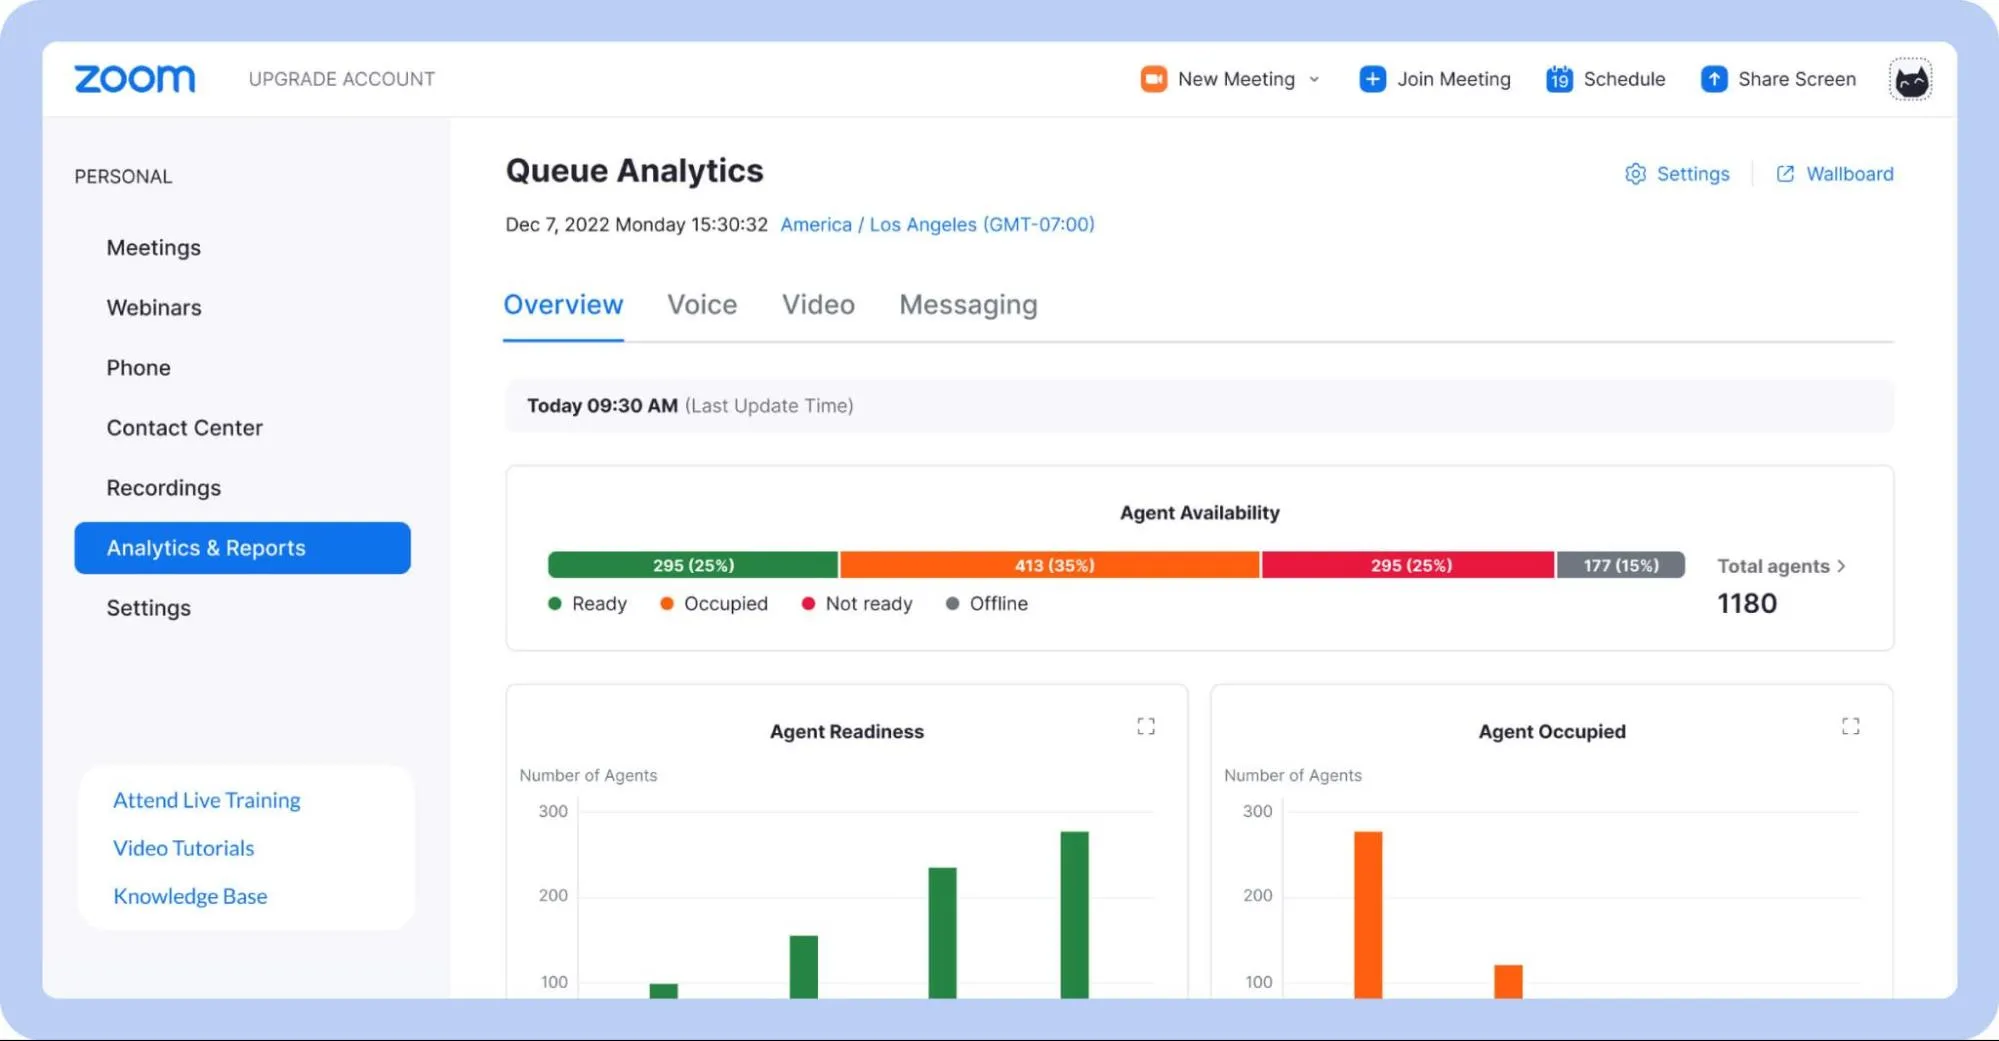
A real-time contact center dashboard delivers an immediate snapshot of current call center activity and performance. Visualizations are designed for quick comprehension, often using gauges, charts, and color-coded alerts to highlight critical information and deviations from target metrics. For example, a gauge might show the current service level, with the needle moving into the red zone if it falls below the target threshold.
Real-time dashboards are essential for proactive management and immediate response to changing conditions. Supervisors use them to monitor call flow, identify bottlenecks, and react quickly to any emerging issues. For instance, if the queue length grows significantly, the supervisor can immediately deploy additional agents to handle the increased volume.
Purpose: Analyze past data to identify trends and inform future strategies
Key metrics:
A historical call center dashboard provides a long-term perspective on call center performance, focusing on trends and patterns. Unlike real-time or operational dashboards that focus on the present, historical dashboards analyze past data to recognize long-term trends, evaluate the effectiveness of past initiatives, and inform future planning.
Historical dashboards play a major role in strategic planning, performance evaluation, and continuous improvement. They allow contact center managers to spot seasonal trends in call volume, understand the long-term impact of process or technology changes, and measure the overall success of the call center in achieving its goals.
Purpose: Forecasts future trends to optimize call center operations
Key metrics:
A predictive call center analytics dashboard goes beyond simply reporting on past performance; it uses historical data and statistical algorithms to forecast future trends and anticipate potential challenges. These dashboards leverage predictive analytics to forecast metrics such as future call volume, anticipated wait times, and required staffing levels.
Predictive dashboards are valuable tools for workforce management, resource planning, and proactive problem-solving. Instead of just showing what has happened, a predictive dashboard aims to forecast what might happen, enabling call centers to proactively prepare and optimize their operations.
Here are some other specialized call center dashboards you might encounter:
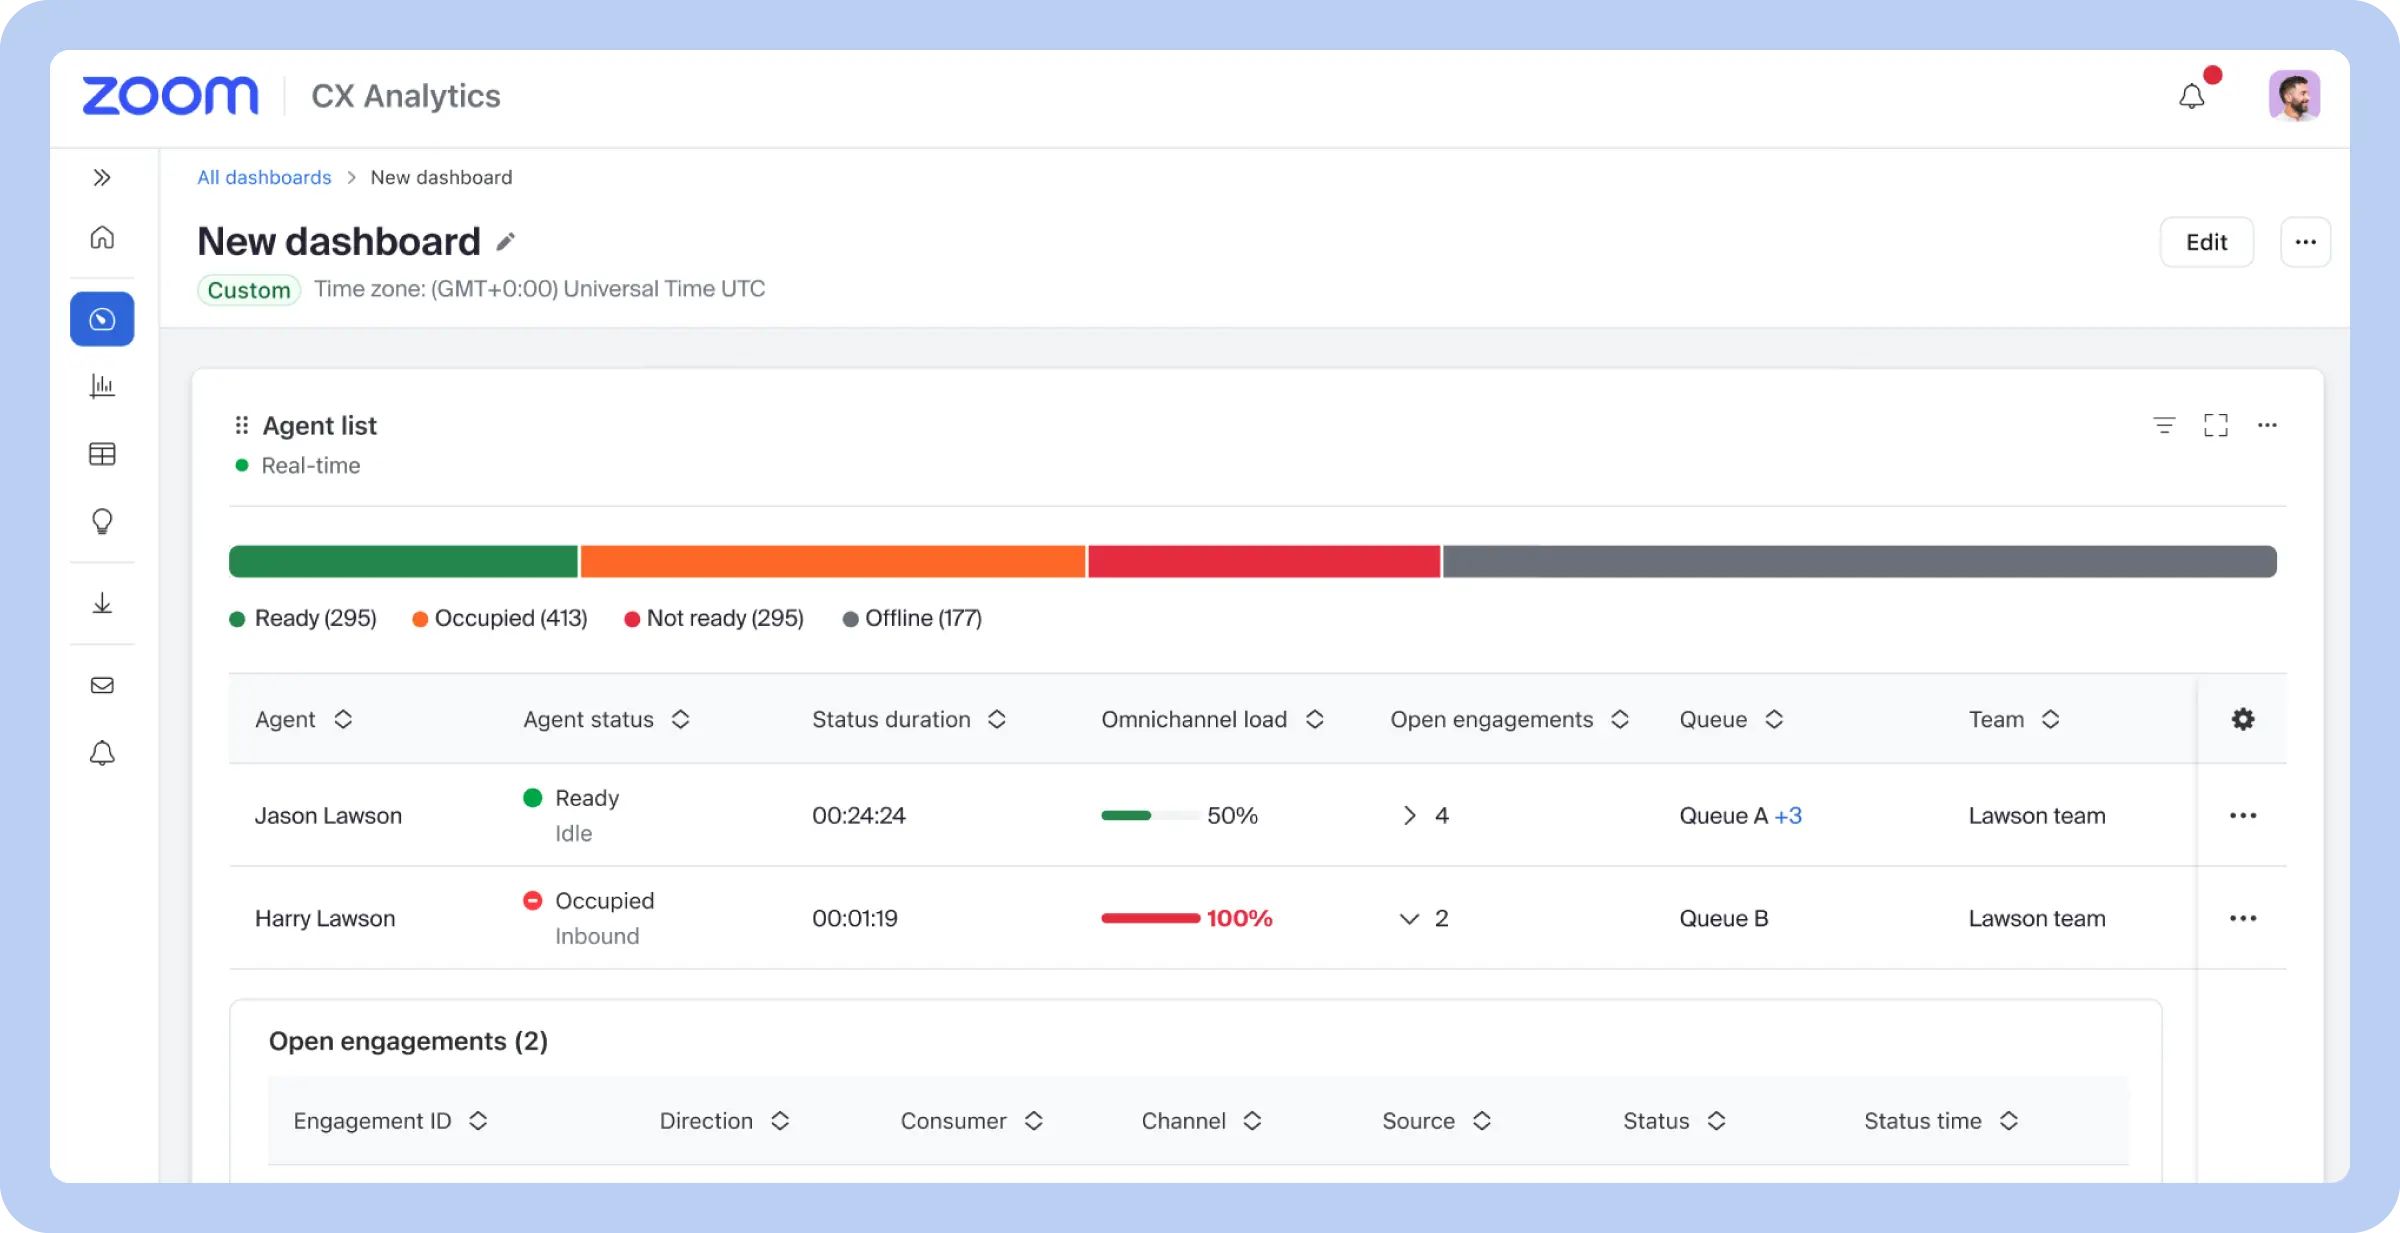
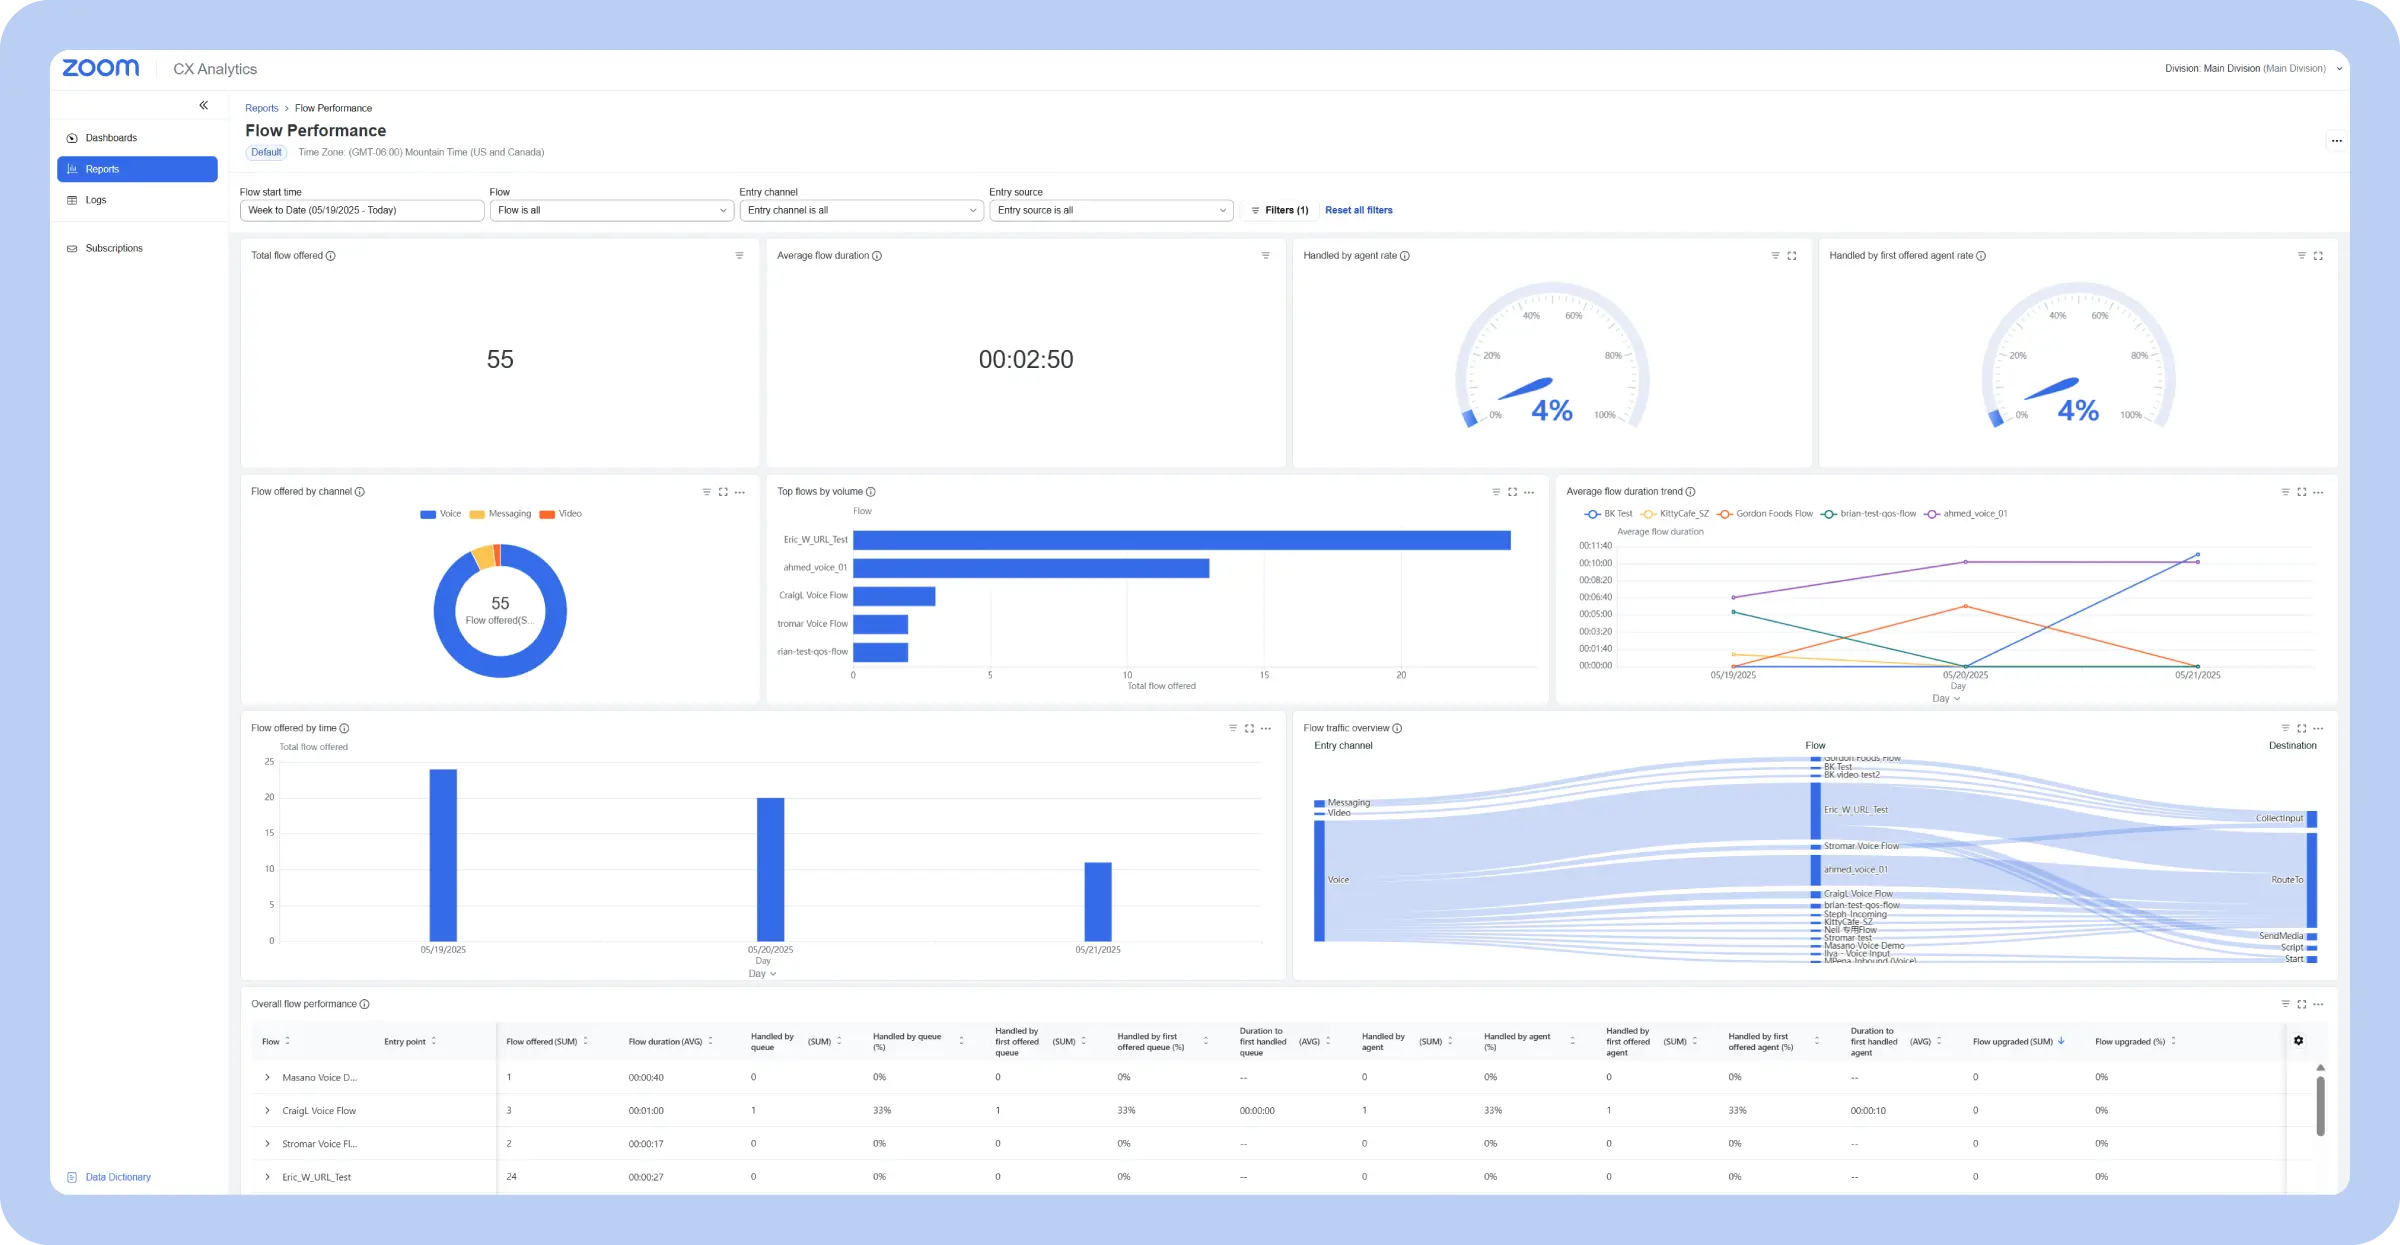
Explore Zoom CX Analytics, where you can configure widgets to track the metrics that matter most to your call center.
Modern contact center solutions go beyond handling calls — they turn customer interactions into actionable insights. Here’s how advanced dashboards optimize operations.
Real-time monitoring gives a complete, up-to-the-second view of your contact center. Track call volume, wait times, agent availability, and service goals on intuitive dashboards. Supervisors can fix issues immediately — rerouting calls, adjusting staffing, or coaching agents on the spot.
Historical reporting shows performance trends over time, including calls, handle times, customer satisfaction, and agent metrics. Use past data to identify busy periods, evaluate changes, and make smarter decisions, rather than relying on guesswork.
Track individual agent performance, including calls handled, resolution rates, call duration, customer feedback, and schedule adherence. Dashboards make it easy to see strengths, spot areas for improvement, and provide targeted coaching to improve team performance and customer satisfaction.
Modern dashboards prioritize customer satisfaction. Integrate surveys, after-call feedback, and social listening to track metrics like CSAT and CES. Seeing the full customer journey helps identify what’s working and where improvements are needed.
Customers use multiple channels — phone, chat, email, social media, SMS — and expect consistent service. Dashboards that consolidate all channels show how customers interact and where issues occur, enabling uniform support across every touchpoint.
Connect your contact center with CRM, workforce management, and other key tools. Automate reporting to save time and use AI to predict metrics such as call volume and handle times, helping with scheduling and operational planning.
Cloud-based dashboards give managers and agents access anytime, anywhere. You can monitor performance in real time from any device and let agents track progress or access resources remotely.
Creating an effective call center reporting dashboard isn’t as simple as throwing a bunch of metrics onto a screen. A poorly designed dashboard can be overwhelming, confusing, and ultimately useless.
Careful planning and thoughtful design are essential to unlocking the power of data visualization. From defining clear objectives to prioritizing visual clarity, these guidelines will help you design a dashboard that can make a real difference in your call center’s performance.
Prioritize visual clarity: Highlight key metrics, avoid clutter, and use charts and graphs that make data easy to digest
If you’re using Zoom CX, explore tools like Zoom Virtual Agent for AI self-service, which can help you quickly address customer needs while continuously optimizing the care it provides. Leverage Zoom Workforce Management to automate forecasting, scheduling, and intraday management capabilities, optimizing your workforce and improving efficiency.
From real-time dashboards and historical reporting to true omnichannel analytics and AI-powered forecasting, you’ll have a single data source of truth that pulls all the data you need into one view. These in-depth insights can help your team optimize staffing, personalize customer interactions, and more, according to your business needs. Get more out of your call center analytics and reporting with Zoom Contact Center, powered by Zoom CX.
*Net Promoter®, NPS®, NPS Prism®, and the NPS-related emoticons are registered trademarks of Bain & Company, Inc., NICE Systems, Inc., and Fred Reichheld. Net Promoter ScoreSM and Net Promoter SystemSM are service marks of Bain & Company, Inc., NICE Systems, Inc., and Fred Reichheld.
For a small call center, focus on KPIs that give the clearest picture of performance without overwhelming the team. Key metrics include:
Start with these core metrics and expand as your team grows or needs deeper insights.
Keep it simple and focused. Put the most important metrics — like call volume, wait times, and agent availability — front and center. Group related info, use colors or charts to make trends pop, and add filters so supervisors can dig into details without clutter.
You can start with a template from tools like Zoom, Tableau, Microsoft Power BI, or your call center software and tweak it to fit your team.
Zoom CX is a strong choice, offering real-time, customizable dashboards with AI insights and omnichannel tracking for agents, supervisors, and execs. Other strong options include Talkdesk and Zendesk Talk with Explore, which also let teams create tailored dashboards and quickly drill down into key metrics.


